RDPSoft

Remote Desktop and Terminal Server Software

We Monitor, Manage & Fix RDS, AVD, Citrix and Parallels RAS
  • Products / Services
    • Not Sure Where To Start?
    • The Complete Monitoring and Management Bundle For End User Computing
    • RDS / AVD Monitoring & Reporting
      • Remote Desktop Commander Suite
      • Sysmundo
    • RDS / AVD Management and RMM Tools
      • Remote Desktop Commander Lite (Free RDS/AVD Management Tool)
      • Remote Assistance RMM Tool + Delegation of Management for RDS/AVD Support Desk
      • Automatic Resolution of Locked Profiles and Stuck Sessions
    • RDS/AVD Synthetic Login Monitoring / Connection Time / Uptime Monitoring Tools
      • Remote Desktop Canary
    • RDS/AVD/Citrix Profile and Session Problem Remediation
      • Fix My Session
    • Digital Forensics and Incident Response Tools
      • Sysmundo
    • Consulting and Professional Services
      • RDS Performance Audits, Security Audits, and General RDS Consulting
      • Custom Report Design Services
      • Training and Other Professional Services
  • Download
    • RDC Lite: Free RDS/Citrix Session and Farm Manager
    • RDC Lite With Premium Management Features
    • RDC Suite: Installer and Release Notes
    • Remote Desktop Canary – Request a Demo/Trial
    • Sysmundo
    • Request Upgrade To New Version
  • Buy
    • The Complete RDS/AVD Monitoring and Management Bundle Purchase Options
      • Start Monthly Subscription Now
      • Start Annual Subscription Now
    • Remote Desktop Commander Suite Purchase Options
      • Start Monthly Subscription Now
      • Start Annual Subscription Now
      • Buy Perpetual License(s)
    • Premium Management Features Purchase Options
      • Start Monthly Subscription Now
      • Start Annual Subscription Now
    • Remote Desktop Canary Purchase Options
      • Start Monthly Subscription Now
      • Start Annual Subscription Now
    • Fix My Session Purchase Options
      • Start Monthly Subscription Now
      • Start Annual Subscription Now
    • Sysmundo Purchase Options
      • Start Monthly Subscription Now
      • Start Annual Subscription Now
    • Buy Incident Based Support Packages
    • Pricing
  • Blog
  • Support
    • Contact Support / Submit Ticket
    • RDPSoft Knowledge Base
  • Contact
  • Partners

Remote Desktop Performance: Key Metrics to Watch

January 4, 2016 By admin Leave a Comment

So, you’ve implemented a brand new Remote Desktop Services (RDS) or Citrix XenDesktop farm. Now, you want to start monitoring different metrics to get a better handle on Remote Desktop performance in general or maybe determine which users and/or clients are the most costly in terms of resources used.

Here are the key remote desktop performance categories you need to keep an eye on, and why they’re so important:

CPU Usage

While RDS Dynamic Fair Share Scheduling (and the built in Citrix XenApp equivalents) help evenly distribute CPU load amongst “plain vanilla,” “task worker” user sessions, this technology is not a panacea. For some MSPs and on-premise Remote Desktop Services shops, some users will require a much larger share of CPU (implemented via the Windows System Resource Manager) in order to run their beefier software. In other situations, Dynamic Fair Share Scheduling may let you inadvertently stuff too many users on an existing virtual machine, because DFSS will dutily throttle available CPU down to the point where common tasks may take *forever* to complete. Therefore, it is still very important to look at remote desktop CPU consumption patterns by user, even down to the process level running in the user sessions.

Memory Usage

Unlike DFSS above, there is no way to throttle available remote desktop memory per user session, which makes it even more critical to monitor remote desktop memory consumption both by user session aggregate and on a per process basis. By analyzing memory use by user and by process, you can better optimize the farm, and/or silo certain users and/or applications on specific servers that are better provisioned for their memory needs.

Bandwidth Usage

We’ve written at length about Remote Desktop Bandwidth consumption here and here, but many admins continue to be surprised at how much bandwidth RDP or ICA can use, depending on how it has been configured. Remote Desktop Protocol Version 8 and higher can double, triple, or even quadruple bandwidth use in certain use cases when UDP is enabled alongside TCP for transport. Moreover, if you permit transfer of files and screenshots via cut and paste, bandwidth can be consumed in a hurry. Since this has a significant impact on the user experience for others if RDP usage saturates the external Internet link, it’s important to see which users consume the most bandwidth, and what they are doing when they consume it.

Connection Quality

If you’ve moved your RDS farm to Windows Server 2012 or later, you can now get a much greater handle on individual user session latency and “potentially available bandwidth” via new RemoteFX performance counters. This quickly lets you determine if user connection problems are on their end, or if many of your users are experiencing high latency due to a load or networking problem on your end. Unfortunately, these performance counters are not very easy to correlate with individual users, but fortunately, our Remote Desktop Commander Suite can do this automatically for you.

Leverage an Affordable Remote Desktop Performance Monitoring Solution

We’ve touched on four big remote desktop performance monitoring areas above. While Citrix provides some monitoring capabilities in its expensive, upper licensing tiers (via EdgeSight / Director), smaller shops running regular Microsoft Remote Desktop Services are not provided with built in monitoring tools, short of what an admin can script together with PowerShell. While you can look at upper tier monitoring solutions, the per concurrent user price of these tools are rather steep, especially as they are sold through the channel.

For only $9 per server per month, let our Remote Desktop Commander Suite offering monitor each of those areas for you.

Please review our sample reports, demonstration videos, and feature listing now. Then, consider starting your subscription with us. With a 30-day money back guarantee and free initial support, you have absolutely nothing to lose.

Filed Under: Performance Tagged With: remote desktop bandwidth, Remote Desktop CPU, Remote Desktop Memory, remote desktop performance

Flexible Licensing for RDS Tools

December 14, 2015 By admin Leave a Comment

Years ago, we launched a flexible month-to-month subscription licensing program for our Remote Desktop Commander Suite, and the result was phenomenal. The traditional channel-driven, expensive perpetual licensing models used by our competition were simply making less and less sense.

While occasionally we offer promotions, you can always count on this: We offer month-to-month licensing that starts at less than $10 per RDS/XenApp server per month, and at about a $1 per virtual desktop/physical workstation.

For more details, check out our pricing for Remote Desktop Commander.

RDS Tools for Specific Tasks . . . And Within Reach

Small and medium-sized businesses who run server-based computing farms designed around Microsoft Remote Desktop Services or Citrix XenApp continue to enthusiastically embrace our licensing model, thrilled to finally have reliable tools that cover areas like:

  • User activity monitoring
  • Remote Desktop connection logging
  • Remote Desktop session management

. . . and the little features that help with things like enabling Remote Desktop remotely and the demystification of RDP logs.

All with so little additional cost.

Not sure where to start? Determine what your needs are for RDS tools or Learn more about Remote Desktop Commander Suite and its many features.

Updated: January 2021.

Filed Under: Cloud RDP Monitoring, Performance, Remote Desktop Memory Usage, Remote Desktop Protocol, Remote Desktop Reporting, Remote Desktop Services, Terminal Server Monitoring, Uncategorized, XenApp Monitoring, XenApp Reporting Tagged With: RDP monitoring, RDS monitoring, Terminal Server monitoring, XenApp monitoring

RDP Latency – Yes, Virginia, You Can Track It Now…

September 2, 2015 By Andy Milford Leave a Comment

RDP Latency IS Now Trackable in Windows Server 2012

Several weeks ago, I gave a really fun talk at BriForum about the hidden benefits found inside Version 8 of the Remote Desktop Protocol – specifically, the fact that for any given RDP 8 connections to a Windows Server 2012 (or Windows 8) system, you can now track things like session latency, data throughput, assessed bandwidth, error rates, and much more. Provided you know which performance counters to query and how to query them.

The big catch here is not on the client side – you can get Windows 7 updated to use RDP Version 8, and Windows 8 and Windows 10 already run it natively. Plus, most thin clients (the good ones anyway) now support RDP 8.

No, the challenge is on the server side. Each week I talk to evaluators of our tools and ask them what server platform they’re running. Inevitably, the majority seem to answer Windows 2008 R2. Yes, I get it. Windows 2008 still gives you that nice Start Menu that your users know and love. But, to be frank, RDP Version 7 (which is what Windows 2008 uses) stinks when compared to RDP 8.

Why is Version 8 So Awesome For Higher RDP Latency Connections?

Two words: UDP transport. Yep, Microsoft’s RDS gurus REALLY did things right in RDP 8. By default, unless you disable it intentionally or unintentionally (more on that in a later blog article), RDP 8 uses both TCP AND UDP to serve up remote desktops to your clients. I won’t bore you to tears with the internal mechanics, but the key takeaway is this – on marginal, high latency connections (e.g. spotty Wifi, 4G mobile hotspots, overseas WAN links, or satellite), adaptive UDP transport overcomes much of the inherent “guaranteed delivery” limitations of TCP. In doing so, it effectively can increase data throughput from 3x to 10x over previous RDP versions, all while improving the responsiveness experienced by clients interacting with their sessions.

So Beyond Improved RDP Throughput and Responsiveness, Why Should I Upgrade to Windows 2012 Server?

Good question. Because once you do, you can use our software to track every aspect of network connection quality between your RDS servers and your client sessions, whether you want to do it in realtime, or via leveraging the ever expanding set of reports we’re creating. Seriously, what we can do with this information is awesome – it lets you, the admin, get in front of those annoying damn calls from users kvetching about how the connection is dropping, or their screen updates are too slow – etc. See for yourself by watching this video we just recorded showing these features in action:

Tracking RDP Latency and Connection Quality With Remote Desktop Commander


That is really awesome stuff. And I have some Windows 2012 servers already deployed. How can I get a copy of your software to profile my users’ RDP latency and connection quality?

That’s super easy – simply start a monthly subscription of our Remote Desktop Commander Suite for only $9 per server per month. For this extremely affordable monthly rate, you can track RDP latency, RDP bandwidth consumption, CPU and memory consumption by session, plus review detailed session recordings for root cause RDS performance problem analysis and/or terminal server user auditing.

We haven’t rolled on Windows Server 2012 yet. We may wait for Windows Server 2016 next year. Is there anything in the meantime we can do to get some of this information?

Absolutely. Stand up at least one Windows Server 2012 instance in your farm, populate it with the same apps/desktop environments your users need, and then send your “problem children” clients directly over to the Windows 2012 server. If you do that, you can use our software to keep tabs on their connection quality, PLUS they’ll be able to leverage the awesome UDP transport offered by RDP 8.

Filed Under: Cloud RDP Monitoring, Performance, RDP Latency, Remote Desktop Bandwidth, Remote Desktop Protocol, Remote Desktop Reporting, Terminal Server Logging, Terminal Server Monitoring Tagged With: RDP Latency

BriForum Recap: Storm Clouds Over Citrix, Microsoft Rising

August 10, 2015 By Andy Milford Leave a Comment

It’s been a little over two weeks since BriForum 2015 ended out in Denver, and as usual, it was a blast, filled with knowledgeable speakers and engaged attendees covering the entire gamut of virtualization and server-based computing.  This year, I had the privilege of being a BriForum speaker, focusing my talk on the hidden benefits provided by Version 8 of the Remote Desktop Protocol available in Windows 7, Windows 8, Windows Server 2012 and later operating systems.

One of the larger trends I’m seeing, which was echoed by many speakers at BriForum – at least in the server-based computing segment – is how Citrix’s star is fading as a viable solution for mid-market companies.  It’s gotten so bad that key shareholders in Citrix (e.g. Elliot) have effectively forced Citrix to start the spin off of some of its assets and have forced out Mark Templeton as CEO.  There’s a lot to this story, and Gabe Knuth has summed it up much more comprehensively than I can, so read his post for all of the gory details.

What is getting less press, but in my mind is just as or more important, is the fact that Citrix has made critical internal personnel decisions over the past few years leading to offshoring of certain departments with rather poor results.  I noticed the fruit of these decisions years ago when I merely attempted to get XenDesktop/XenApp 6.5 up and running in a lab environment.  A quality software product should not require multiple patches to fix critical issues just to get a solution installed.  And I’m sure CIOs continue to question a.) the high costs of the software itself combined with b.) the high costs of bringing in consultants or other hired guns just to keep their stuff running.  For a smaller or mid-market company without an unlimited budget, this creates a huge incentive to divest themselves of Citrix, and look towards other solutions like VMWare’s Horizon product and “Citrix-lite” alternatives that run on top of RDS.

Which leads me to Microsoft.  Fueled by their expansion of Azure as a comprehensive cloud computing platform, they have been investing *significantly* in remote desktop technologies, especially the latest Remote Desktop Protocol versions.  Their most recent version of the Remote Desktop Protocol, RDP 8, features incredible improvements over previous versions, primarily in the adaptive graphics department AND in the use of UDP as a transport protocol to vastly increase data throughput and responsiveness over less than reliable links (4G, WiFi, Satellite, etc).  While not as bleeding edge as Citrix’s emerging Framehawk technologies in extremely high loss networks, it’s simply *good enough* for the vast majority of corporate networks and teleworking scenarios.  And as we’ve seen in the past, once Microsoft gets *good enough* in a certain market / technology area, they tend to dominate.  Remember Novell, anyone? 🙂

As for us, we’re charting our path alongside Microsoft.  While our software continues to support Citrix and other configurations running on top of RDS, woe be to vendors who are “Citrix only” in their design focus, as I think they’re going to be competing for an ever shrinking piece of the pie.  There will be a lot of money to be made over the coming years on migrating people AWAY from Citrix on to pure Remote Desktop Services, and we will be a proud part of that vendor ecosystem.

Filed Under: Performance, Remote Desktop Protocol, Remote Desktop Reporting, Remote Desktop Services, Software Releases, Terminal Server Monitoring, Uncategorized, XenApp Monitoring, XenApp Reporting Tagged With: Citrix, Microsoft, RDP 8, SMBs

How To: Terminal Server Performance Tracking With Remote Desktop Reporter

March 2, 2015 By admin Leave a Comment

In a previous blog post, we reviewed how the Remote Desktop Reporter Agent is able to track CPU and memory use by user session. With version 3.0 and later in Remote Desktop Reporter, performance reporting across RDS, Citrix XenApp, and other Server-Based Computing platforms has been expanded dramatically. So, here’s a how-to with some helpful tips on getting the most out of Terminal Server performance tracking using Remote Desktop Reporter.

Different Approaches to Terminal Server Performance Tracking

In a server based computing (SBC) environment, tracking performance is critical, as one wayward app consuming a lot of CPU cycles or memory in a single session can impact user experience severely across the other user sessions.

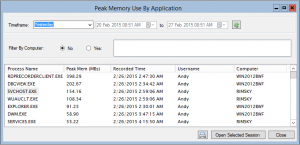
Peak Memory Use by Application Dashboard Screenshot
Screenshot of the Peak Memory Use by Application Dashboard in Remote Desktop Reporter.

Simple server-based monitoring tools may be able to tell you whether or not a server is experiencing high CPU or memory load, but they seldom can indicate what user session was experiencing the problem, and more importantly, how the problem initially developed for root cause analysis.

This is where Remote Desktop Reporter is different. Using the new Remote Desktop Reporter Agent, performance metrics are routinely gathered from all participating user sessions and stored centrally in a database.

Terminal Server Performance Tracking By User Session or Application

In the event of a server performance issue, it’s easy to very quickly zero in on the particular application or user session causing the problem. From there, an administrator can step through the session’s performance history to determine what led up to the problem.

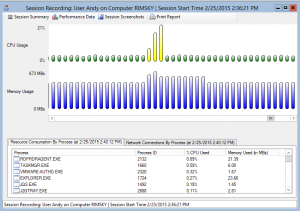
Session Explorer Dialog Screenshot from Remote Desktop Reporter
Effective Terminal Server performance tracking requires visibility to CPU and memory use. With Remote Desktop Reporter, you can step through the entire CPU and memory consumption of a session.

The new Peak Memory Use By Application Dashboard in the Remote Desktop Reporter Analysis Client allows an admin to quickly see which applications were using the most memory across monitored Remote Desktop servers in a given timeframe.

More importantly, it shows the user associated with the session, as well as the server on which the session was running and the time when the application was using the greatest amount of memory.

If an admin selects an Application and clicks the “Open Selected Session” button, they can quickly step through the entire CPU and memory consumption of the Terminal Server session in the Session Explorer dialog.

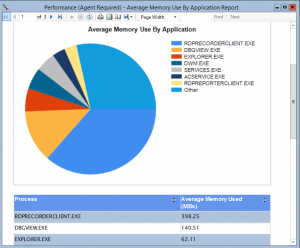
Average Memory Use By Application

Screenshot of average memory use by application graph in Remote Desktop Reporter
Average memory use by application graphed in Remote Desktop Reporter.

In contrast, if admins simply want to see which applications consume the most memory on average in user sessions, they can use the new Average Memory Use By Application Dashboard.

This information can also be limited to a specific timeframe and to a specific group of terminal servers as needed. As we all know, cutting out noise to focus on the exact time of trouble or the specific group of culprits saves time and headaches.

Finally, keep in mind that this data is also accessible via ad-hoc or scheduled reports. Simply select the Performance – Average Memory Use By Application or Performance – Peak Memory Use By Application reports and pair them with any desired filters.

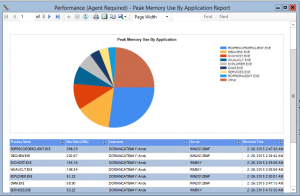
Screenshot of peak memory use by application graph in Remote Desktop Reporter - key for Terminal Server performance tracking.
Peak memory use by application.

What About VDI User Sessions and Physical Desktops?

While the above Terminal Server performance tracking examples were focused on diagnosing performance issues on terminal servers and Citrix XenApp servers, it’s worth mentioning that the Remote Desktop Reporter Agent can grab these same metrics from VDI user sessions and even physical desktop sessions.

As always, Remote Desktop Reporter – including the Remote Desktop Reporter Agent – is available for download as a free trial software.

Have more questions about Remote Desktop Reporter and performance tracking across your entire network, including on-premise, private cloud, and even MSP environments?

Contact us with your questions. Your insights might even inspire our next blog article!

Filed Under: Performance, Remote Desktop Reporting Tagged With: application, performance tracking, user session

  • « Previous Page
  • 1
  • 2
  • Email
  • Google+
  • LinkedIn
  • Twitter
  • YouTube

Not Sure Where To Start?

In just a few moments, you can find the right fit of solutions and even services for your needs.

> Get Going Now.

Help Documents

Remote Desktop Commander
Help and Users Guide
Release Notes (ver 6.x)

Sign Up for Remote Desktop Tips and RDPSoft Updates

Blog Topic Categories

  • Azure RemoteApp
  • Azure Virtual Desktop
  • citrix edgesight
  • Citrix Edgesight Replacement
  • Citrix Shadowing
  • Cloud RDP Monitoring
  • DEX
  • Performance
  • RDP Disconnects
  • RDP Latency
  • RDP Login Time
  • RDP Login Tracking
  • RDP Logon Failure Tracking
  • RDP Logs
  • RDP Loss Rate
  • RDP Security
  • RDP Transmission Rate
  • RDS Infrastructure
  • RDS License Metering
  • RDS Licensing
  • Remote Desktop Bandwidth
  • Remote Desktop CPU
  • Remote Desktop Management
  • Remote Desktop Memory
  • Remote Desktop Memory Usage
  • Remote Desktop Monitoring
  • Remote Desktop Performance
  • Remote Desktop Protocol
  • Remote Desktop Reporting
  • Remote Desktop Security
  • Remote Desktop Services
  • Remote Desktop Services Free Tools
  • Remote Desktop Services Hotfix
  • Sensitive Data
  • Server 2012 TSAdmin Replacement
  • Shadow User
  • Software Releases
  • SPLA Reporting
  • Synthetic RDP
  • Sysmon
  • Telecommuting/Teleworking
  • Terminal Server Logging
  • Terminal Server Monitoring
  • Uncategorized
  • User Activity Monitoring
  • User Productivity
  • User Profiles
  • Windows 2008 Terminal Server
  • Windows Virtual Desktop
  • WVD Login Time
  • XenApp Monitoring
  • XenApp Reporting

Recent Posts

  • Fix My Session v1 Now Available!
  • How To Perform User Activity Monitoring in Azure Virtual Desktop
  • Remote Desktop Commander v7 Now Available!
  • How To Deploy Sysmon The Easy Way
  • Remote Desktop Canary v4.0 Now Available!

From the RDPSoft Blog

  • Fix My Session v1 Now Available!
  • How To Perform User Activity Monitoring in Azure Virtual Desktop
  • Remote Desktop Commander v7 Now Available!
  • How To Deploy Sysmon The Easy Way
  • Remote Desktop Canary v4.0 Now Available!
  • Email
  • Google+
  • LinkedIn
  • Twitter
  • YouTube

We Do “Single Pane of Glass” Monitoring and Management for RDS

Top Level Deployment Dashboard

One of the biggest criticisms leveled against Microsoft's Remote Desktop Services as an end user computing (EUC) platform is its complete lack of integrated management and monitoring tools. … Learn more about our centralized RDS monitoring and management >

Reach Out

For fastest response, reach out via our sales and support contact forms.

Sales
US: 1-855-738-8457 x1
Outside the US: 1-702-749-4325 x1

Support
for Evaluators and Priority Support Customers
US: 1-855-738-8457 x2
Outside the US: 1-702-749-4325 x2

© Copyright 2013–2025 RDPSoft. All Rights Reserved. RDPSoft is the sole authorized publisher and distributor of the following software titles: Remote Desktop Commander, Premium Management Features, Remote Desktop Canary · Sitemap