RDPSoft

Remote Desktop and Terminal Server Software

We Monitor, Manage & Fix RDS, AVD, Citrix and Parallels RAS
  • Products / Services
    • Not Sure Where To Start?
    • The Complete Monitoring and Management Bundle For End User Computing
    • RDS / AVD Monitoring & Reporting
      • Remote Desktop Commander Suite
      • Sysmundo
    • RDS / AVD Management and RMM Tools
      • Remote Desktop Commander Lite (Free RDS/AVD Management Tool)
      • Remote Assistance RMM Tool + Delegation of Management for RDS/AVD Support Desk
      • Automatic Resolution of Locked Profiles and Stuck Sessions
    • RDS/AVD Synthetic Login Monitoring / Connection Time / Uptime Monitoring Tools
      • Remote Desktop Canary
    • RDS/AVD/Citrix Profile and Session Problem Remediation
      • Fix My Session
    • Digital Forensics and Incident Response Tools
      • Sysmundo
    • Consulting and Professional Services
      • RDS Performance Audits, Security Audits, and General RDS Consulting
      • Custom Report Design Services
      • Training and Other Professional Services
  • Download
    • RDC Lite: Free RDS/Citrix Session and Farm Manager
    • RDC Lite With Premium Management Features
    • RDC Suite: Installer and Release Notes
    • Remote Desktop Canary – Request a Demo/Trial
    • Sysmundo
    • Request Upgrade To New Version
  • Buy
    • The Complete RDS/AVD Monitoring and Management Bundle Purchase Options
      • Start Monthly Subscription Now
      • Start Annual Subscription Now
    • Remote Desktop Commander Suite Purchase Options
      • Start Monthly Subscription Now
      • Start Annual Subscription Now
      • Buy Perpetual License(s)
    • Premium Management Features Purchase Options
      • Start Monthly Subscription Now
      • Start Annual Subscription Now
    • Remote Desktop Canary Purchase Options
      • Start Monthly Subscription Now
      • Start Annual Subscription Now
    • Fix My Session Purchase Options
      • Start Monthly Subscription Now
      • Start Annual Subscription Now
    • Sysmundo Purchase Options
      • Start Monthly Subscription Now
      • Start Annual Subscription Now
    • Buy Incident Based Support Packages
    • Pricing
  • Blog
  • Support
    • Contact Support / Submit Ticket
    • RDPSoft Knowledge Base
  • Contact
  • Partners

How To: Monitoring RDP Bandwidth In Real Time and Session By Session

July 13, 2015 By admin Leave a Comment

We’ve written at length about how the Remote Desktop Reporter component of our Remote Desktop Commander Suite excels at tracking RDP bandwidth consumption over time and how it is capable of generating many different reports to track this consumption by user or by computer. We’ve also mentioned how crucial it is to apply the recently released Microsoft Hotfixes so that bandwidth data is queryable on a Windows 2012 server.

But, is there an easier way to at least keep an eye on RDP bandwidth without the reporting?

The Growing Importance of RDP Bandwidth Monitoring

It is imperative that admins do something – even if it doesn’t involve reporting – before bigger problems crop up. Now that more and more shops are migrating to Windows Server 2012, it is all the more important to start monitoring RDP bandwidth. Why? Due to vast improvements in the RDP 8.0 protocol, such as adaptive graphics and combined UDP/TCP transport of data, remote desktop data throughput has been greatly enhanced.

And, what does that mean? Much larger amounts of data transferred on average. Therefore, it’s perhaps more important than ever before to stay on top of it.

Reviewing RDP Bandwidth Data In Real Time

In many cases, admins may want to simply review this data in real time, to see on a day-to-day basis which users are transferring the most data. If this is the case, our Remote Desktop Commander Suite offering (at least at first glance) might appear to be overkill.

Not a problem. Our Remote Desktop Commander Lite is perfect for this purpose.

RDP Bandwidth
RDP bandwidth by session, viewed in Remote Desktop Commander Lite

When in session view, Remote Desktop Commander Lite automatically displays total RDP bandwidth transferred in each user’s session. If you click on the RDP bandwidth column, users are grouped sorted from greatest consumption to least consumption.

When arranged in this fashion, it’s easy to spot the outliers. From there, you can message the user to find out what they’re doing and disconnect or reset their session.  You can also jump into process view to see what programs they’re running that could be the culprit.

Happy hunting of your bandwidth hogs – please be merciful to your users!

Do you have questions about how Remote Desktop Commander Lite can assist with your RDP bandwidth monitoring needs? Contact RDPSoft or start a conversation below.

Filed Under: Remote Desktop Bandwidth Tagged With: cloud RDP monitoring, RDP bandwidth, remote desktop mangement, Terminal Server monitoring

Monitoring Remote Desktop Memory Usage in Real Time With Remote Desktop Commander

June 29, 2015 By admin Leave a Comment

Of all the critical system resources that must be monitored on a Terminal Server or other Server Based Computing environment, memory usage is one of the most important.

If you’ve worked with Citrix or Microsoft RDS for any length of time, you’ve seen how servers can grow unresponsive when an errant process has a memory leak, which is more common then many might think. The RDP Clipboard applet (rdpclip.exe), which runs in each user’s session, is one of the most notorious culprits in this regard.

Which is why we at RDPSoft always found it odd that the Remote Desktop Services Manager (aka TSAdmin) never had an integrated way of showing memory usage by process, by user, by computer, or by session.

Enter Remote Desktop Commander

We decided to fix that in Remote Desktop Commander Lite, our integrated Terminal Server session and process management utility.

Process Memory Consumption

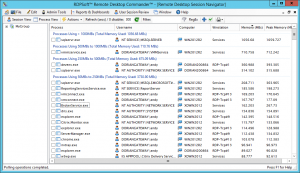
View of process memory consumption in Remote Desktop Commander
Viewing process memory consumption, grouped by heaviest memory consumers first

Rather than attempting to get this information from performance counters with WMI, which can be dreadfully slow, we used low-level native calls in a multi-threaded architecture to return memory statistics with blazing fast speed across systems in your farm.

Peak Process Memory Consumption

More than just current memory usage by process, you can also track peak memory usage by process. This is incredibly important, because sometimes a process temporarily allocates a huge chunk of memory, works with it, and then deallocates it.

View of peak process memory consumption in Remote Desktop Commander
Viewing peak process memory consumption

However, during that peak allocation, if memory is already running near maximum capacity, this can cause a performance impact on your server. And even if the process goes back to “normal memory use,” you can still get a clue as to how greedy it was with memory at a prior moment.

Memory Consumption Per User, Computer, Session, and More . . .

And finally, reviewing memory consumption per user, per computer, or per session is trivially easy.

View of process memory consumption by user group
Viewing process memory consumption by grouped user

Simply switch into Process View in Remote Desktop Commander Lite, and then click on the appropriate column (e.g. User, Computer, or Winstation).

Voila. Remote Desktop Commander will automatically tally the total memory for each grouping and display it to you.

How Can You Leverage These Capabilities Today?

Trial software for Remote Desktop Commander Lite is available for free, and you can download it right now.

Questions? Reach out to RDPSoft or comment below.

Filed Under: Remote Desktop Memory Usage Tagged With: cloud RDP monitoring, performance, remote desktop management, XenApp monitoring

Calculating RDP Bandwidth on Windows Server 2012

March 29, 2015 By admin Leave a Comment

As we’ve discussed previously on this blog, we discovered a bug in Windows 8, Windows 8.1, Windows Server 2012, and Windows Server 2012 R2 some time ago that prevented our software from being able to calculate RDP bandwidth used per RDS user and per RDS session on these operating systems. We kept an eye on it and along the way provided an update on the issue with calculating RDP bandwidth.

A Hotfix From Microsoft

Microsoft worked diligently with us in 2014, and by the end of that year, had released two hotfixes (one for Windows 8 and Windows Server 2012, the other for Windows 8.1 and Windows Server 2012 R2).  These hotfixes are now available for download.

UPDATE: Now, in 2016, these hotfixes have been incorporated into updates for the above operating systems, particularly Windows Server 2012 R2. So, provided your systems are being routinely updated, these bandwidth counters should be functioning again.

Once you apply the above appropriate hotfixes (and/or updates) to your Terminal Server farm, you can then start leveraging Remote Desktop Reporter to track RDP bandwidth consumption in a variety of ways.

A New Family of Reports Targeting RDP Bandwidth

With the release of Version 3.0 of Remote Desktop Reporter, we offer a new RDP Bandwidth report family – Bandwidth Consumption By User.

Remote Desktop Reporter RDP bandwidth report
Report in Remote Desktop Reporter showing bandwidth transferred by user.

This new class of reports can aggregate all of the RDP bandwidth usage by individual users across multiple servers by day, by week, or even by month.  It’s great to quickly pinpoint users that are most expensive in terms of the bandwidth they consume. This information also can be useful for MSPs who need to meter bandwidth usage by their clients.

As with all Remote Desktop Reporter reports, it’s easy to filter by user(s), server(s), and/or date and time.

Get Started Today Tracking RDP Bandwidth

So, what are you waiting for?  Apply the hotfixes/updates to your Windows 2012 servers, and then start a monthly subscription of our Remote Desktop Commander Suite for only $9 per server per month. In addition to the RDP bandwidth reports above, you will have complete visibility into user activity on your terminal servers, whether it be CPU consumption, memory consumption, session recordings, user time tracking, or even RDP latency/connection quality.


Filed Under: Remote Desktop Bandwidth Tagged With: RDP, remote desktop reporting

How To Track Levels of Per User SAL Licensing with SPL Tracker

March 7, 2015 By admin Leave a Comment

When we brought our Service Provider Licensing Tracker – SPL Tracker – to market in the middle of 2014, we focused first on two of the most common per user Subscription Access Licenses (SALs) that Managed Service Providers (MSPs) have to track – Remote Desktop Services SALs and Microsoft Office SALs.

Comparing Actual Usage and Allocated Usage

Since our companion Remote Desktop Reporter utility continually stores session activity metrics from server-based computing platforms like Microsoft RDS and Citrix XenApp, the SPL Tracker is able to compare actual usage to allocated usage for RDS SALs and Office SALs.

Screenshot of SPL Tracker tracking license usage.
Tracking SAL usage with SPL Tracker.

This capability demonstrates for MSPs the amount of licensing waste for these classes of licenses. It also provides a mechanism to de-allocate inactive users by removing them as a member from domain access control groups.

However, there are many different types of per user SAL licensing that must be accounted for in the Microsoft SPLA program, including those licenses that are not “used” within a server-based computing session. Perhaps the most prominent example is Exchange SALs.

Sometimes You Want to Track Usage, Sometimes You Don’t

Therefore, in version 3.0 and later of our SPL Tracker, we have a new definable license type that does not attempt to track usage of this kind of license.

Screenshot from SPL Tracker 3.0 showing per user SAL licensing capabilities.
Tracking per user SAL licensing with SPL Tracker 3.0.

With this new definition type, MSPs can create additional license types for per user SAL licensing they must report to Microsoft, and then pair up each license type with the Active Directory group that controls access to that class of license.  Even though actual usage will not be tracked, as long as the MSP takes steps during their user provisioning process to add them to the correct AD groups according to the licensed services they will be using, our SPL Tracker will show the allocated usage in its automated monthly reports.

Easy Per User Licensing for Tracking Per User SAL Licensing and More

With extremely affordable monthly subscription per user licensing plans, it’s easy to deploy Remote Desktop Reporter with the SPL Tracker in a managed services environment.  And, with the money saved by 1) automating license tracking and 2) recapturing license waste, this solution pays for itself in short order.

Want to talk tech on how you can leverage SPL Tracker in your environment?  Contact us now and we’ll be happy to discuss the possibilities.

Filed Under: SPLA Reporting Tagged With: Microsoft Exchange, per user SAL licensing, per user SALs

How To: Terminal Server Performance Tracking With Remote Desktop Reporter

March 2, 2015 By admin Leave a Comment

In a previous blog post, we reviewed how the Remote Desktop Reporter Agent is able to track CPU and memory use by user session. With version 3.0 and later in Remote Desktop Reporter, performance reporting across RDS, Citrix XenApp, and other Server-Based Computing platforms has been expanded dramatically. So, here’s a how-to with some helpful tips on getting the most out of Terminal Server performance tracking using Remote Desktop Reporter.

Different Approaches to Terminal Server Performance Tracking

In a server based computing (SBC) environment, tracking performance is critical, as one wayward app consuming a lot of CPU cycles or memory in a single session can impact user experience severely across the other user sessions.

Peak Memory Use by Application Dashboard Screenshot
Screenshot of the Peak Memory Use by Application Dashboard in Remote Desktop Reporter.

Simple server-based monitoring tools may be able to tell you whether or not a server is experiencing high CPU or memory load, but they seldom can indicate what user session was experiencing the problem, and more importantly, how the problem initially developed for root cause analysis.

This is where Remote Desktop Reporter is different. Using the new Remote Desktop Reporter Agent, performance metrics are routinely gathered from all participating user sessions and stored centrally in a database.

Terminal Server Performance Tracking By User Session or Application

In the event of a server performance issue, it’s easy to very quickly zero in on the particular application or user session causing the problem. From there, an administrator can step through the session’s performance history to determine what led up to the problem.

Session Explorer Dialog Screenshot from Remote Desktop Reporter
Effective Terminal Server performance tracking requires visibility to CPU and memory use. With Remote Desktop Reporter, you can step through the entire CPU and memory consumption of a session.

The new Peak Memory Use By Application Dashboard in the Remote Desktop Reporter Analysis Client allows an admin to quickly see which applications were using the most memory across monitored Remote Desktop servers in a given timeframe.

More importantly, it shows the user associated with the session, as well as the server on which the session was running and the time when the application was using the greatest amount of memory.

If an admin selects an Application and clicks the “Open Selected Session” button, they can quickly step through the entire CPU and memory consumption of the Terminal Server session in the Session Explorer dialog.

Average Memory Use By Application

Screenshot of average memory use by application graph in Remote Desktop Reporter
Average memory use by application graphed in Remote Desktop Reporter.

In contrast, if admins simply want to see which applications consume the most memory on average in user sessions, they can use the new Average Memory Use By Application Dashboard.

This information can also be limited to a specific timeframe and to a specific group of terminal servers as needed. As we all know, cutting out noise to focus on the exact time of trouble or the specific group of culprits saves time and headaches.

Finally, keep in mind that this data is also accessible via ad-hoc or scheduled reports. Simply select the Performance – Average Memory Use By Application or Performance – Peak Memory Use By Application reports and pair them with any desired filters.

Screenshot of peak memory use by application graph in Remote Desktop Reporter - key for Terminal Server performance tracking.
Peak memory use by application.

What About VDI User Sessions and Physical Desktops?

While the above Terminal Server performance tracking examples were focused on diagnosing performance issues on terminal servers and Citrix XenApp servers, it’s worth mentioning that the Remote Desktop Reporter Agent can grab these same metrics from VDI user sessions and even physical desktop sessions.

As always, Remote Desktop Reporter – including the Remote Desktop Reporter Agent – is available for download as a free trial software.

Have more questions about Remote Desktop Reporter and performance tracking across your entire network, including on-premise, private cloud, and even MSP environments?

Contact us with your questions. Your insights might even inspire our next blog article!

Filed Under: Performance, Remote Desktop Reporting Tagged With: application, performance tracking, user session

  • « Previous Page
  • 1
  • …
  • 12
  • 13
  • 14
  • 15
  • 16
  • …
  • 19
  • Next Page »
  • Email
  • Google+
  • LinkedIn
  • Twitter
  • YouTube

Not Sure Where To Start?

In just a few moments, you can find the right fit of solutions and even services for your needs.

> Get Going Now.

Help Documents

Remote Desktop Commander
Help and Users Guide
Release Notes (ver 6.x)

Sign Up for Remote Desktop Tips and RDPSoft Updates

Blog Topic Categories

  • Azure RemoteApp
  • Azure Virtual Desktop
  • citrix edgesight
  • Citrix Edgesight Replacement
  • Citrix Shadowing
  • Cloud RDP Monitoring
  • DEX
  • Performance
  • RDP Disconnects
  • RDP Latency
  • RDP Login Time
  • RDP Login Tracking
  • RDP Logon Failure Tracking
  • RDP Logs
  • RDP Loss Rate
  • RDP Security
  • RDP Transmission Rate
  • RDS Infrastructure
  • RDS License Metering
  • RDS Licensing
  • Remote Desktop Bandwidth
  • Remote Desktop CPU
  • Remote Desktop Management
  • Remote Desktop Memory
  • Remote Desktop Memory Usage
  • Remote Desktop Monitoring
  • Remote Desktop Performance
  • Remote Desktop Protocol
  • Remote Desktop Reporting
  • Remote Desktop Security
  • Remote Desktop Services
  • Remote Desktop Services Free Tools
  • Remote Desktop Services Hotfix
  • Sensitive Data
  • Server 2012 TSAdmin Replacement
  • Shadow User
  • Software Releases
  • SPLA Reporting
  • Synthetic RDP
  • Sysmon
  • Telecommuting/Teleworking
  • Terminal Server Logging
  • Terminal Server Monitoring
  • Uncategorized
  • User Activity Monitoring
  • User Productivity
  • User Profiles
  • Windows 2008 Terminal Server
  • Windows Virtual Desktop
  • WVD Login Time
  • XenApp Monitoring
  • XenApp Reporting

Recent Posts

  • Fix My Session v1 Now Available!
  • How To Perform User Activity Monitoring in Azure Virtual Desktop
  • Remote Desktop Commander v7 Now Available!
  • How To Deploy Sysmon The Easy Way
  • Remote Desktop Canary v4.0 Now Available!

From the RDPSoft Blog

  • Fix My Session v1 Now Available!
  • How To Perform User Activity Monitoring in Azure Virtual Desktop
  • Remote Desktop Commander v7 Now Available!
  • How To Deploy Sysmon The Easy Way
  • Remote Desktop Canary v4.0 Now Available!
  • Email
  • Google+
  • LinkedIn
  • Twitter
  • YouTube

We Do “Single Pane of Glass” Monitoring and Management for RDS

Top Level Deployment Dashboard

One of the biggest criticisms leveled against Microsoft's Remote Desktop Services as an end user computing (EUC) platform is its complete lack of integrated management and monitoring tools. … Learn more about our centralized RDS monitoring and management >

Reach Out

For fastest response, reach out via our sales and support contact forms.

Sales
US: 1-855-738-8457 x1
Outside the US: 1-702-749-4325 x1

Support
for Evaluators and Priority Support Customers
US: 1-855-738-8457 x2
Outside the US: 1-702-749-4325 x2

© Copyright 2013–2025 RDPSoft. All Rights Reserved. RDPSoft is the sole authorized publisher and distributor of the following software titles: Remote Desktop Commander, Premium Management Features, Remote Desktop Canary · Sitemap