In need of monitoring for Azure Virtual Desktop (AVD)? We’ve got good news for you.
As part of our Complete Monitoring and Management Bundle for EUC, Remote Desktop Commander Suite, Remote Desktop Canary, and Fix My Session all help you monitor and manage multiple aspects of your AVD deployments.
We wrote this quick guide to show you how to implement AVD monitoring for your deployment via an easy, step-by-step approach . . .
Step 1: Provision a VM inside your AVD tenant or Azure resource group to run our software.
You may already have a VM deployed with AVD management and monitoring tools on it, or you may wish to deploy a new one. All of our solutions work perfectly well on Windows Server 2016, Server 2019, Server 2022, Server 2025 or on Windows 10 or Windows 11 Enterprise multi-session (EVD) hosts. You can elect to place this VM in its own separate host pool – and then publish it as a desktop to your help desk and admin team so they can connect in and run tools when needed via the Azure Virtual Desktop client. If you are supporting a smaller AVD tenant (e.g. fewer than 10 hosts), you can probably utilize a cost-effective B-series VM.
The key thing to remember is that this VM should be located on the same VNet and joined to the same Active Directory + Azure Active Directory domain as the AVD hosts you will be monitoring. Note: If you are now running Azure Virtual Desktop Hybrid, make sure to place our tools on a VM in the same local network (preferably same subnet) as your local VMs running the RDS session host role.
Step 2: Install SQL Server Express or use Azure SQL to store the AVD monitoring data collected by our solutions.
If you have a small AVD deployment, with 10 or fewer hosts, you can most likely install SQL Server Express 2025 on the VM you created in Step 1 above. The Remote Desktop Commander Suite installer will prompt to do this for you automatically. The latest version of Remote Desktop Commander Suite v8 supports SQL Server Express 2025, which boasts a much larger maximum database size of 50 GBs. This is perfect for small to medium size AVD tenants.
If you have a larger AVD deployment, you can leverage SQL Server Standard OR an Azure SQL database to store the AVD monitoring data instead. If you already have a SQL Server standard instance in your tenant, wonderful – just use our software’s SQL setup wizard to connect to that SQL server and provision a new database. If you do not have SQL Server standard in place, contact our sales team for a quote, and request a discount to defray the costs of utilizing a 2 vCPU SQL Server Standard subscription with our software. This will save you considerable money when compared to using Azure Log Analytics with AVD insights, as SQL Server licensing is a flat cost that does not tax you for the granular ingestion of AVD performance data that you need for troubleshooting.
If you’d rather use Azure SQL, we find the most cost-effective approach is opting for a single database, per-DTU model (as opposed to vCore). Using this approach, Azure SQL database costs for 90% of our customers have in the past run somewhere between $30 and $150 USD per month, depending on the number of AVD hosts they are monitoring. Here’s a step-by-step guide on how to provision Azure SQL for our solutions.
Step 3: Define a service account in your domain for AVD monitoring, and make Windows firewall and registry adjustments.
You may need to make a few adjustments on your Azure Virtual Desktop hosts to allow them to be monitored correctly, especially if they are running Windows 10 or Windows 11 Enterprise multi-session. Also, you might decide to define a GPO in your Active Directory that adjusts these settings for you.
Step 4: Install the Remote Desktop Commander Suite, Remote Desktop Canary, and Fix My Sesssion products to the VM you provisioned earlier.
Install the Remote Desktop Commander Suite on the VM you created in Step 1. Link it to SQL Server Express, SQL Server Standard, or Azure SQL, and set its service account.
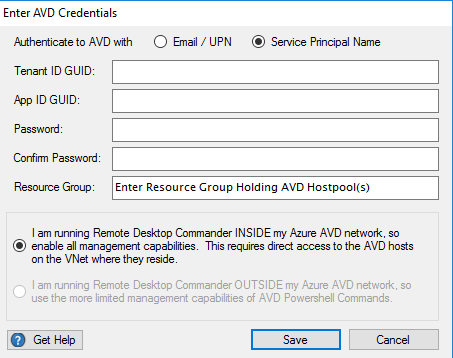
Then, add the AVD hosts via the Remote Desktop Commander Configuration Tool, using the Import From AVD Broker wizard, or import them directly from your Active Directory’s computer account list. The best way to surface hosts and host pools in our solutions is to set up an App Registration with SPN that has appropriate role assignments in your AVD resource group to enumerate and take action on those resources. Please review this comprehensive PDF guide on how to do that. You can use this newly created App Registration across the Remote Desktop Commander Suite, Remote Desktop Canary, and Fix My Session products.
Optionally, if you would like to collect rich, detailed information on performance per user session and per application, as well as client side endpoint metrics for in-depth AVD troubleshooting, install the agent service on each AVD host.

Next, install our Remote Desktop Canary solution on the same VM. Use Remote Desktop Canary’s Workflow Builder Wizard to setup a synthetic testing mechanism for all of your AVD hosts in a matter of minutes.
Now, Remote Desktop Canary can begin to continuously monitor your AVD hosts, verifying their responsiveness all the way through the login sequence into the desktop presentation. In AVD (as compared to RDS), Microsoft now handles the infrastructure roles of the Gateway and Broker. This means that determining login problems, slow login times, and user profile/black screen issues requires a close eye on the AVD hosts themselves.
Better yet, if your AVD environment is currently experiencing hung sessions and/or locked FSLogix profiles, leverage our Fix My Session solution so that users can fix those issues themselves without raising new support tickets, while you use our other tools to figure out the root cause.


Step 5 – Launch your AVD client, connect to the VM, and prepare to be amazed!
Again, note that you are connecting to the VM you created in Step 1 above.
And now, you can marvel at the rich analytics and AVD monitoring tools available at your fingertips.


Easy, huh? Ready to get started? Begin a monthly subscription to our Complete Monitoring and Management Bundle starting at only $26.99 per host per month, or begin a monthly subscription to the Remote Desktop Commander Suite at only $14.99 per host per month.
Also, we love providing support to our customers, so if you get stuck anywhere in this setup process or have questions about your new monitoring capabilities, just reach out. We’ll be happy to help you.
Updated: June 2026.

Leave a Reply