RDPSoft

Remote Desktop and Terminal Server Software

We Monitor, Manage & Fix RDS, AVD, Citrix and Parallels RAS
  • Products / Services
    • Not Sure Where To Start?
    • The Complete Monitoring and Management Bundle For End User Computing
    • RDS / AVD Monitoring & Reporting
      • Remote Desktop Commander Suite
      • Sysmundo
    • RDS / AVD Management and RMM Tools
      • Remote Desktop Commander Lite (Free RDS/AVD Management Tool)
      • Remote Assistance RMM Tool + Delegation of Management for RDS/AVD Support Desk
      • Automatic Resolution of Locked Profiles and Stuck Sessions
    • RDS/AVD Synthetic Login Monitoring / Connection Time / Uptime Monitoring Tools
      • Remote Desktop Canary
    • RDS/AVD/Citrix Profile and Session Problem Remediation
      • Fix My Session
    • Digital Forensics and Incident Response Tools
      • Sysmundo
    • Consulting and Professional Services
      • RDS Performance Audits, Security Audits, and General RDS Consulting
      • Custom Report Design Services
      • Training and Other Professional Services
  • Download
    • RDC Lite: Free RDS/Citrix Session and Farm Manager
    • RDC Lite With Premium Management Features
    • RDC Suite: Installer and Release Notes
    • Remote Desktop Canary – Request a Demo/Trial
    • Sysmundo
    • Request Upgrade To New Version
  • Buy
    • The Complete RDS/AVD Monitoring and Management Bundle Purchase Options
      • Start Monthly Subscription Now
      • Start Annual Subscription Now
    • Remote Desktop Commander Suite Purchase Options
      • Start Monthly Subscription Now
      • Start Annual Subscription Now
      • Buy Perpetual License(s)
    • Premium Management Features Purchase Options
      • Start Monthly Subscription Now
      • Start Annual Subscription Now
    • Remote Desktop Canary Purchase Options
      • Start Monthly Subscription Now
      • Start Annual Subscription Now
    • Fix My Session Purchase Options
      • Start Monthly Subscription Now
      • Start Annual Subscription Now
    • Sysmundo Purchase Options
      • Start Monthly Subscription Now
      • Start Annual Subscription Now
    • Buy Incident Based Support Packages
    • Pricing
  • Blog
  • Support
    • Contact Support / Submit Ticket
    • RDPSoft Knowledge Base
  • Contact
  • Partners

How To: Terminal Server Performance Tracking With Remote Desktop Reporter

March 2, 2015 By admin Leave a Comment

In a previous blog post, we reviewed how the Remote Desktop Reporter Agent is able to track CPU and memory use by user session. With version 3.0 and later in Remote Desktop Reporter, performance reporting across RDS, Citrix XenApp, and other Server-Based Computing platforms has been expanded dramatically. So, here’s a how-to with some helpful tips on getting the most out of Terminal Server performance tracking using Remote Desktop Reporter.

Different Approaches to Terminal Server Performance Tracking

In a server based computing (SBC) environment, tracking performance is critical, as one wayward app consuming a lot of CPU cycles or memory in a single session can impact user experience severely across the other user sessions.
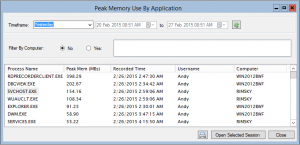
Peak Memory Use by Application Dashboard Screenshot
Screenshot of the Peak Memory Use by Application Dashboard in Remote Desktop Reporter.

Simple server-based monitoring tools may be able to tell you whether or not a server is experiencing high CPU or memory load, but they seldom can indicate what user session was experiencing the problem, and more importantly, how the problem initially developed for root cause analysis.

This is where Remote Desktop Reporter is different. Using the new Remote Desktop Reporter Agent, performance metrics are routinely gathered from all participating user sessions and stored centrally in a database.

Terminal Server Performance Tracking By User Session or Application

In the event of a server performance issue, it’s easy to very quickly zero in on the particular application or user session causing the problem. From there, an administrator can step through the session’s performance history to determine what led up to the problem.
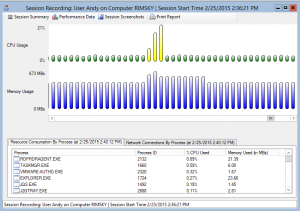
Session Explorer Dialog Screenshot from Remote Desktop Reporter
Effective Terminal Server performance tracking requires visibility to CPU and memory use. With Remote Desktop Reporter, you can step through the entire CPU and memory consumption of a session.

The new Peak Memory Use By Application Dashboard in the Remote Desktop Reporter Analysis Client allows an admin to quickly see which applications were using the most memory across monitored Remote Desktop servers in a given timeframe.

More importantly, it shows the user associated with the session, as well as the server on which the session was running and the time when the application was using the greatest amount of memory.

If an admin selects an Application and clicks the “Open Selected Session” button, they can quickly step through the entire CPU and memory consumption of the Terminal Server session in the Session Explorer dialog.

Average Memory Use By Application
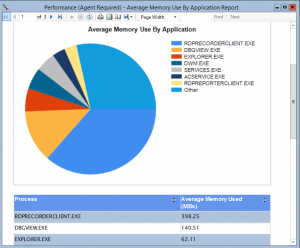
Screenshot of average memory use by application graph in Remote Desktop Reporter
Average memory use by application graphed in Remote Desktop Reporter.

In contrast, if admins simply want to see which applications consume the most memory on average in user sessions, they can use the new Average Memory Use By Application Dashboard.

This information can also be limited to a specific timeframe and to a specific group of terminal servers as needed. As we all know, cutting out noise to focus on the exact time of trouble or the specific group of culprits saves time and headaches.

Finally, keep in mind that this data is also accessible via ad-hoc or scheduled reports. Simply select the Performance – Average Memory Use By Application or Performance – Peak Memory Use By Application reports and pair them with any desired filters.
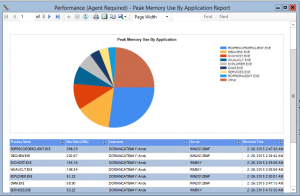
Screenshot of peak memory use by application graph in Remote Desktop Reporter - key for Terminal Server performance tracking.
Peak memory use by application.

What About VDI User Sessions and Physical Desktops?

While the above Terminal Server performance tracking examples were focused on diagnosing performance issues on terminal servers and Citrix XenApp servers, it’s worth mentioning that the Remote Desktop Reporter Agent can grab these same metrics from VDI user sessions and even physical desktop sessions.

As always, Remote Desktop Reporter – including the Remote Desktop Reporter Agent – is available for download as a free trial software.

Have more questions about Remote Desktop Reporter and performance tracking across your entire network, including on-premise, private cloud, and even MSP environments?

Contact us with your questions. Your insights might even inspire our next blog article!

Filed Under: Performance, Remote Desktop Reporting Tagged With: application, performance tracking, user session

  • Email
  • Google+
  • LinkedIn
  • Twitter
  • YouTube

Not Sure Where To Start?

In just a few moments, you can find the right fit of solutions and even services for your needs.

> Get Going Now.

Help Documents

Remote Desktop Commander
Help and Users Guide
Release Notes (ver 6.x)

Sign Up for Remote Desktop Tips and RDPSoft Updates

Blog Topic Categories

  • Azure RemoteApp
  • Azure Virtual Desktop
  • citrix edgesight
  • Citrix Edgesight Replacement
  • Citrix Shadowing
  • Cloud RDP Monitoring
  • DEX
  • Performance
  • RDP Disconnects
  • RDP Latency
  • RDP Login Time
  • RDP Login Tracking
  • RDP Logon Failure Tracking
  • RDP Logs
  • RDP Loss Rate
  • RDP Security
  • RDP Transmission Rate
  • RDS Infrastructure
  • RDS License Metering
  • RDS Licensing
  • Remote Desktop Bandwidth
  • Remote Desktop CPU
  • Remote Desktop Management
  • Remote Desktop Memory
  • Remote Desktop Memory Usage
  • Remote Desktop Monitoring
  • Remote Desktop Performance
  • Remote Desktop Protocol
  • Remote Desktop Reporting
  • Remote Desktop Security
  • Remote Desktop Services
  • Remote Desktop Services Free Tools
  • Remote Desktop Services Hotfix
  • Sensitive Data
  • Server 2012 TSAdmin Replacement
  • Shadow User
  • Software Releases
  • SPLA Reporting
  • Synthetic RDP
  • Sysmon
  • Telecommuting/Teleworking
  • Terminal Server Logging
  • Terminal Server Monitoring
  • Uncategorized
  • User Activity Monitoring
  • User Productivity
  • User Profiles
  • Windows 2008 Terminal Server
  • Windows Virtual Desktop
  • WVD Login Time
  • XenApp Monitoring
  • XenApp Reporting

Recent Posts

  • Fix My Session v1 Now Available!
  • How To Perform User Activity Monitoring in Azure Virtual Desktop
  • Remote Desktop Commander v7 Now Available!
  • How To Deploy Sysmon The Easy Way
  • Remote Desktop Canary v4.0 Now Available!

From the RDPSoft Blog

  • Fix My Session v1 Now Available!
  • How To Perform User Activity Monitoring in Azure Virtual Desktop
  • Remote Desktop Commander v7 Now Available!
  • How To Deploy Sysmon The Easy Way
  • Remote Desktop Canary v4.0 Now Available!
  • Email
  • Google+
  • LinkedIn
  • Twitter
  • YouTube

We Do “Single Pane of Glass” Monitoring and Management for RDS

Top Level Deployment Dashboard

One of the biggest criticisms leveled against Microsoft's Remote Desktop Services as an end user computing (EUC) platform is its complete lack of integrated management and monitoring tools. … Learn more about our centralized RDS monitoring and management >

Reach Out

For fastest response, reach out via our sales and support contact forms.

Sales
US: 1-855-738-8457 x1
Outside the US: 1-702-749-4325 x1

Support
for Evaluators and Priority Support Customers
US: 1-855-738-8457 x2
Outside the US: 1-702-749-4325 x2

© Copyright 2013–2025 RDPSoft. All Rights Reserved. RDPSoft is the sole authorized publisher and distributor of the following software titles: Remote Desktop Commander, Premium Management Features, Remote Desktop Canary · Sitemap