RDPSoft

Remote Desktop Services and Azure Virtual Desktop Software

We Monitor, Manage & Fix RDS, AVD, Citrix and Parallels RAS
  • Products / Services
    • Not Sure Where To Start?
    • The Complete Monitoring and Management Bundle For End User Computing
    • RDS / AVD Monitoring & Reporting
      • Remote Desktop Commander Suite
      • Sysmundo
    • RDS / AVD Management and RMM Tools
      • Remote Desktop Commander Lite (Free RDS/AVD Management Tool)
      • Remote Assistance RMM Tool + Delegation of Management for RDS/AVD Support Desk
      • Automatic Resolution of Locked Profiles and Stuck Sessions
    • RDS/AVD Synthetic Login Monitoring / Connection Time / Uptime Monitoring Tools
      • Remote Desktop Canary
    • RDS/AVD/Citrix Profile and Session Problem Remediation
      • Fix My Session
    • Digital Forensics and Incident Response Tools
      • Sysmundo
    • Consulting and Professional Services
      • RDS Performance Audits, Security Audits, and General RDS Consulting
      • Custom Report Design Services
      • Training and Other Professional Services
  • Download
    • RDC Lite: Free RDS/Citrix Session and Farm Manager
    • RDC Lite With Premium Management Features
    • RDC Suite: Installer and Release Notes
    • Remote Desktop Canary – Request a Demo/Trial
    • Sysmundo
    • Request Upgrade To New Version
  • Buy
    • The Complete RDS/AVD Monitoring and Management Bundle Purchase Options
      • Start Monthly Subscription Now
      • Start Annual Subscription Now
    • Remote Desktop Commander Suite Purchase Options
      • Start Monthly Subscription Now
      • Start Annual Subscription Now
    • Premium Management Features Purchase Options
      • Start Monthly Subscription Now
      • Start Annual Subscription Now
    • Remote Desktop Canary Purchase Options
      • Start Monthly Subscription Now
      • Start Annual Subscription Now
    • Fix My Session Purchase Options
      • Start Monthly Subscription Now
      • Start Annual Subscription Now
    • Sysmundo Purchase Options
      • Start Monthly Subscription Now
      • Start Annual Subscription Now
    • Buy Incident Based Support Packages
    • Pricing
  • Blog
  • Support
    • Contact Support / Submit Ticket
    • RDPSoft Knowledge Base
  • Contact
  • Partners

We Fixed Remote Desktop Shadowing (And Some Other Stuff)

May 8, 2019 By Andy Milford Leave a Comment

One of the continuous laments that we’ve heard from our customer base, for years now concerns user session shadowing in Remote Desktop Services.  This is a shame, because the internal architecture for shadowing from Windows Server 2012 R2 onwards is pretty amazing.

Using MSTSC to shadow however, eh, not so much.

Let’s Face It: Remote Desktop Shadowing Hasn’t Been a Great Experience For, Well . . . Forever!

The litany of complaints includes problems like:

  • lack of proper shadowing support (zoom out) for multiple monitor sessions
  • dreaded permissions errors
  • the unfortunate requirement for help desk users to be administrators on the terminal servers they want to shadow
  • the inability for Windows 7 systems to initiate shadowing on Server 2012/2016/2019 systems and Windows 8 and 10 workstations.

There was also the small issue that there were no tools for shadowing/remote assistance inside Windows Virtual Desktop in Azure.

As a result, admins and IT staff have been paying an arm and a leg for remote assistance tools to bridge this gap – tools that require heavy install footprints, hundreds or even thousands of dollars per technician per year, and tedious invitation URLs, etc are required to start helping users.

Which Reminds Us: Delegation of Administration Options for Remote Desktop Services Have Been Nonexistent For Way Too Long!

The other need that we hear frequently from our customers is the ability to precisely delegate Remote Desktop Services management permissions to their help desk and front line support staff.  To date, the only real option has been to give help desk staff admin rights on session hosts and connection brokers.  Not an ideal situation from a security, or a “whoops I just rebooted a terminal server with 30 user sessions running line of business apps” perspective.

We tried to resolve some of these issues with our RDSConfig utility, that allowed permissions reassignment for users and groups on session hosts.  However, in larger RDS collections, you need a way to apply those permissions to a huge swath of session hosts all at once – especially as new session hosts are brought online.  Also, to do their jobs, help desk staff need rights to query the Connection Broker to dynamically list RDS collections and the servers that are members of each, plus they should have the ability to read RDS-related performance counters on those session hosts, so they can troubleshoot things like network latency from the client to the server.

So, We Figured Out How To Make Shadowing Much Better AND Created a Wizard To Let You Delegate RDS Management Tasks To Your Help Desk Staff

We call these new tools in the Remote Desktop Commander Client Premium Management Features.  For $99.99 per admin or help desk user per year, all of the aforementioned problems go away.  Want to shadow Server 2012+ systems from Windows 7?  No problem.  Want to monitor multiple user sessions at once in live view in one window?  We do that.  Do you have RDS users with multiple monitors that you haven’t been able to shadow before? Again, we’ve got you covered.

Watch this quick video on YouTube to see these features in action:

Next, download the latest copy of the Remote Desktop Commander Lite client.  Once you install it, you’ll be able to preview the SuperShadow features for 15 days.  The RDS Management Delegation Wizard becomes available after you purchase a subscription from us. 

Once you start your subscription, you’ll immediately be emailed a license file that will unlock all of those features.

SuperShadow


**Note 1: With the release of Premium Management Features in Remote Desktop Commander Lite, legacy shadowing support for Windows Server 2008 and legacy shadowing through the MSTSC client were retired. These features remain available in our Remote Desktop Commander Suite solution however.

**Note 2: If you are an existing Remote Desktop Commander Suite customer who would like to test these new Premium Management Features, please install the latest client on a VM or system OTHER than the system running the core Remote Desktop Commander Suite components.

Updated: November 2020.

Filed Under: Software Releases Tagged With: mstsc, multimon shadowing, multiple monitor shadowing, remote desktop shadowing, session shadowing, terminal server shadowing

RDS Logins & Logon Failure Tracking (And More) in Remote Desktop Commander v4.5+

September 27, 2018 By admin Leave a Comment

Though later versions of our Remote Desktop Commander Suite build on these key features, it’s worth drilling into these specific capabilities in RDS logins and logon failure tracking (plus some extra stuff we’re sure will interest you) that were introduced starting with v4.5:

Consolidate All RDS Logins and Logon Failures, Regardless Whether Or Not They Occurred On Session Hosts Or Remote Desktop Gateway Servers

Our CEO, Andy Milford, has written at length about the challenges faced when attempting to correlate RDP logon failure data from session hosts at his PureRDS.org blog. Attempting to track successful RDP logins is no picnic either, as multiple log files from multiple different systems – the session host servers and remote desktop gateway servers – must be consulted and the information correlated.

In version 4.5 of the Remote Desktop Commander Suite, the Remote Desktop Reporter Service automatically collects and correlates key events from event log files on Session Host servers and Remote Desktop Gateway servers. The result is a treasure trove of valuable login and logon failure data that it retains in its SQL database, allowing us to deliver the incredible new features described below.

Geolocate RDS Logins and Logon Failures In the User IP Geolocation Dashboard – Find Out Where Your Users Are Working From, and Locate the Source Of Brute Force RDP Hack Attempts

Geolocate RDP Logon Failures
Perform deep analysis of RDP logon failures and user logins using the User IP Geolocation Dashboard.

Remote Desktop Services login and logon failure data correlation from session hosts and gateways is a valuable feature in its own right, but the rich visualizations of this data is what sets Remote Desktop Commander Version 4.5+ apart from the competition. The User IP Geolocation Dashboard combines IP geolocation data with interactive worldwide maps and tabular, filterable tables so administrators can zero in on both legitimate RDS users and hackers.

Locate The Source of RDP Brute Force Hack Attempts
Filter RDP logon failure and login data by username, time frame, computer, and sort the data by username, region, country etc.

Our dashboard is completely extensible via PowerShell scripts, which are designed to receive selected server names, usernames, and IP addresses as input parameters. This is especially useful for the remediation of inbound hack attempts.

Remediate Brute Force RDP Attacks
Extend the capabilities of the dashboard with PowerShell

Instantly build reports from the filtered RDP login and logon failure data in the dashboard, or simply export the data to comma-delimited text.

Report on RDP Logon Failures
Export RDP login data and generate reports in PDF, Word, or Excel.

Schedule Daily User Login and Logon Failure Reports

RDP Logon Failure Reports
Build RDP login reports manually, or schedule them to run daily to gain insight on where users are connecting from.

Scheduled reports make it easy to keep track of both where your users are routinely connecting from, as well as the sources of hacking and penetration attempts. Group login and logon failure data by country or by user. With routine review of these reports, you can quickly spot geographic RDP login anomalies that could be suggestive of a compromised user account.

See The Actual IP Address and Geolocation Information for User Sessions In Existing Time Tracking Reports.

By default, the Microsoft Terminal Services client (MSTSC) does not report its actual global IP address when connecting to a terminal server. When connecting through a Remote Desktop Gateway system, no IP address information is transmitted at all. Many admins have requested that we transform the incorrect or missing IP address information with the actual global IP address of the user, whether or not they are connecting through a RD Gateway.

Based on this feedback, we have retrofitted several existing reports, such as the User Sessions – Session Details By User report family, to include the correct global IP of the user based on the correlated log data now collected by our central polling service. Also, when possible, the global IP address is accompanied with the geographic region of the user’s ISP

Remote Desktop User Time Tracking Report
Many existing user activity reports now include the resolved, Global IP of the user, and ISP geolocation information when available.

Massively Reduce Database Storage Requirements With Performance Threshold Database Pruning

As you can see, we’ve mainly talked about logins and logon failures so far, and we’re talking about lots of data that we work with. So, we have to be ready to handle it all. Which brings us to a related feature.

Collecting in-depth performance data on a per-user and per-program basis with our agent service is great, but it’s easy to generate a lot of data in SQL by doing so. Version 4.5+ has a nifty new feature that we call “Performance Threshold Database Pruning.”

Now, in addition to purging out agent-based performance data based on date, you can elect to keep only the agent data associated with times of high load on session host servers. You can define what you consider to be high load both in terms of CPU usage or memory utilization, or a combination of both. Using this new feature can drastically reduce the amount of data stored in SQL over time, in many cases by over 80%.

Control RDS Performance Database Growth
Using Performance Threshold Database Tuning, tightly control the size of your SQL database growth.

. . . And What’s The Latest?

Of course, features change and mature, so be sure to find out the latest developments with our Remote Desktop Commander Suite by requesting a web demo with an RDPSoft solutions expert.

Updated: November 2020.

Filed Under: Software Releases Tagged With: geolocating RDP logins, rdp hack attempt, rdp login, rdp logon failure, RDP Security, RDS Security

Remote Desktop Commander v4 Now Available

January 29, 2018 By admin Leave a Comment

Greetings friends and current Remote Desktop Commander customers! We’ve just released Version 4.0 of Remote Desktop Commander, both the Lite and Suite editions, so we want to tell you what’s new under the hood in terms of features.

In this RDPSoft E-Newsletter:


New Remote Desktop Commander 4.0 Features

Introducing RDS Performance Audits, Custom Report Design Work, and White Glove Installation

Our Technology Alliance Partner, FSLogix, Is Simply the Best Solution for Office 365 Deployments Inside RDS, Citrix, and VDI

RDC 4.0 Download and Upgrade Links

New features include:

  • Pinpoint Historic CPU, Memory, and Other Session Load Bottlenecks on Servers Instantly With “Historical Performance and Load Across the Farm” Dashboard

  • Quickly Filter Dashboards By Date Range and RDS Collection Name or Server Group

  • Azure and Standard SQL Server Authentication Support

  • Adjust RDP Permissions on Session Hosts Directly In the Session Navigator

  • Speed Improvements and Other Bug Fixes

Pinpoint Historic CPU, Memory, and Other Session Load Bottlenecks on Servers Instantly With “Historical Performance and Load Across the Farm” Dashboard

This Feature Is Present In the Following Editions: Suite
Previous versions of Remote Desktop Commander allowed you to view recent performance metrics across your servers, as well as pull up snapshots of performance for all user sessions given a specific period of time. However, the new Historical Performance And Load Across The Farm Dashboard allows you to scroll through hour-by-hour graphs of when your RDS session host servers were under peak load, in terms of memory, CPU, or session count. The graph is interactive, so you can click on a point of interest, and be immediately transported to another dashboard that shows all of the sessions active in that time frame- so you can review the user session(s) that contributed most to the server load and determine what they were doing at the time.

Historical Performance And Load Across the Farm
Track CPU, Memory, and Session Counts On Your RDS Servers Over Time

Historical Performance And Load Across the Farm (2)
Pinpoint Times of High Resource Utilization on RDS Session Hosts.

Historical Performance And Load Across the Farm (3)

Review Which Users Caused High Resource Utilization
After Clicking On a Timeframe of High Resource Utilization, Immediately See Which Users Impacted the Session Host(s) Most.

Quickly Filter Dashboards By Date Range and RDS Collection Name / Server Groups

This Feature Is Present In the Following Editions: Suite
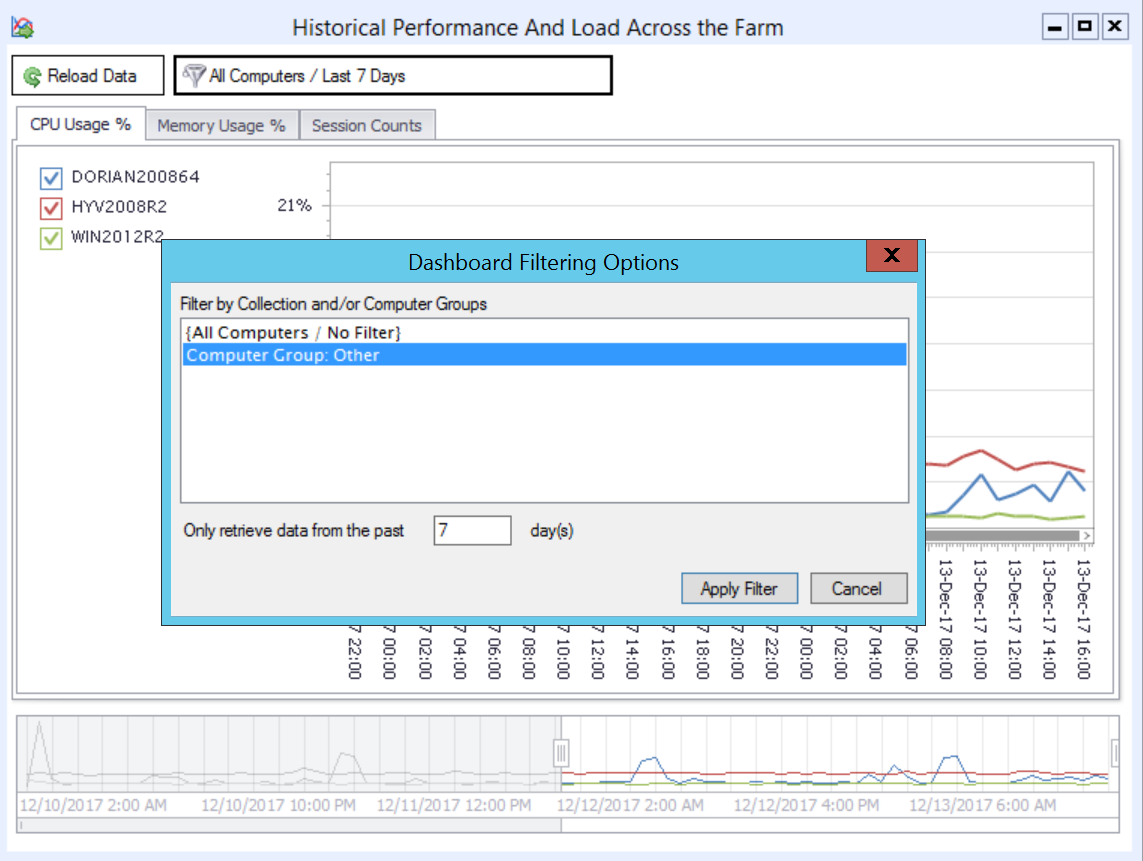
For organizations with larger RDS deployments, attempting to review all of the session host servers in a single dashboard can get complicated. Version 4 of Remote Desktop Commander allows you to quickly filter dashboards by a 1.) RDS collection name, 2.) user-defined group of RDS servers, and 3.) in some cases, a date range lookback. By doing so, you can keep multiple dashboards up and running inside the Remote Desktop Commander Client, with one dashboard per RDS collection.

Filter Dashboards By RDS Collections
Limit the Scope of Session Hosts Shown in Dashboards By Filtering By Collection Name or Computer Grouping.


Filtered Dashboard By Computer Group
A Dashboard With Fewer Elements Filtered By RDS Collection Name / Computer Group

Azure and Standard SQL Server Authentication Support

This Feature Is Present In the Following Editions: Suite
Previous versions of Remote Desktop Commander required use of a local SQL Server deployment with Windows Integrated Authentication. Version 4 now also allows you to use a.) an on-premise SQL server with Standard (explicit username/password) Authentication and/or b.) a Microsoft Azure SQL Server deployment. This provides organizations with the flexibility to create multiple SQL databases for multiple RDS deployments on a single SQL Server, even when each deployment is isolated in a different, non-trusting Windows domain.

Now Use Standard SQL Connections and Azure SQL Connections to Store and Review RDS Data

Adjust RDP Permissions on Session Hosts Directly In the Session Navigator

This Feature Is Present In the Following Editions: Lite and Suite

In the summer of 2017, Andy Milford, CEO of RDPSoft and Microsoft MVP in the Remote Desktop Services category, released the beta version of the new free tool called RDSConfig at the PureRDS.org resource site he maintains. Just as TSAdmin was removed from Windows Server 2012, TSConfig was similarly removed, making it very difficult for RDS admins to adjust the RDP permissions on session hosts. This has prevented many organizations from being able to delegate certain RDS management roles to non-admin users, such as shadowing users for support purposes. In Version 4 of Remote Desktop Commander, this tool has been integrated into the Session Navigator area of both the Lite and Suite versions. Now admins can easily view and adjust RDP permissions on their session hosts any time they wish.

GUI to Adjust RDP Permissions
View and edit RDP permissions directly inside Remote Desktop Commander.

Adjusting RDP Permissions Granularly
Use the RDSConfig utility to view and adjust RDP permissions on your session hosts.

Speed Improvements and Other Bug Fixes

In version 4 of Remote Desktop Commander, we have optimized many SQL queries to speed the retrieval of historic performance data to the Client. Also, we have repaired a few bugs, including one that affected the ability to record screenshots from multiple monitor sessions in certain instances.

New RDS Consulting Services: Schedule an RDS Performance Audit, Request Custom Reports, or Schedule White Glove Installation

2017 was a great year for RDPSoft, and to celebrate our continuing growth, we’re now pleased to offer additional services to go along with our Remote Desktop Commander Suite solution.

  • RDS Performance Audit
  • Administrator time is at a premium these days. Often, you may know there is a performance issue with your RDS farm, but you don’t have the time to figure it out on your own. Let RDPSoft do that for you. We will install our Remote Desktop Commander Suite software in your environment, and then gather up key performance metrics, including data from RDS-related event logs and installed Hotfixes. After gathering data for a week, we will build a comprehensive report that benchmarks performance in your farm and offers suggestions on how to improve it. You don’t even need to have your own instance of Microsoft SQL available for data collection – we can provide you with a secure connection to an Azure SQL database as part of this service. For more detailed information, and to request a quote, click here.

  • Custom Report Design
  • Do you need a report that’s not available out of the box? Let the RDPSoft team build that for you. Using the free Microsoft Report Builder tool, we can design custom SQL queries and RDLC templates that connect into our Remote Desktop Commander database. Click here for more information and to request a quote.

  • White Glove Installation
  • For only $99, an RDPSoft technician will establish a remote support session with you and install the Remote Desktop Commander Suite software. This service includes a.) installing the software, b.) linking it to a SQL Server Express, SQL Server, or Azure SQL database, c.) adding session hosts / workstations for monitoring, d.) verifying that data is being collected properly, and e.) verifying that the data is displayed properly in reports and the Remote Desktop Commander Client. Click here to purchase this service and schedule a time with an RDPSoft support expert.

Rolling Out Office 365 in RDS, Citrix, or VDI? FSLogix Is Your Lifesaver.

If you attempt an Office 365 deployment inside a virtualized environment, including RDS and VDI, you will be hit with lots of snags. Our technology alliance partner, FSLogix, pioneered the solution to these issues, and they remain the best solution in the market for virtualized Office 365 roll outs. Please read this wonderful article and product comparison that details why they remain the best-of-breed solution.

Remote Desktop Commander 4 Download and Upgrade Links

If you are an existing Remote Desktop Commander SUITE subscription licensee and/or active maintenance agreement holder, click here to request upgrade instructions.

If you are an existing Remote Desktop Commander LITE user, click here to download the latest version, which you can install directly over previous Remote Desktop Commander Lite versions.

If you’d like to learn more about the Remote Desktop Commander Suite, including its feature set and how to start a subscription for only $9.99 per server per month, click here.

Filed Under: Software Releases Tagged With: Azure SQL, RDP, RDS Performance Audit, Remote Desktop Services Performance

Version 4 of Remote Desktop Commander Almost Ready!

December 14, 2017 By admin Leave a Comment

Hello friends and existing customers! We’re excited to let you know that the release of Remote Desktop Commander v4 is just about ready, and wanted to give you a sneak peak of all of the new features it contains.

We will be releasing Version 4 shortly after the start of the new year, along with a small price increase – our first price increase in over 18 months. If you’d like to test drive a release candidate of version 4, please complete the form here and mention that you want to try the release candidate of Version 4 in your comments.

New Remote Desktop Commander 4 Features

Now You Can Pinpoint Historic CPU, Memory, and Other Session Load Bottlenecks on Servers Instantly With the “Historical Performance and Load Across the Farm” Dashboard

Previous versions of Remote Desktop Commander allowed you to view recent performance metrics across your servers, as well as pull up snapshots of performance for all user sessions given a specific period of time. However, the new Historical Performance And Load Across The Farm Dashboard allows you to scroll through hour-by-hour graphs of when your RDS session host servers were under peak load, in terms of memory, CPU, or session count. The graph is interactive, so you can click on a point of interest, and you will immediately be transported to another dashboard that shows you all of the sessions active in that time frame, so you can review the user session(s) that contributed most to the server load and determine what they were doing at the time.

Historical Performance And Load Across the Farm
Track CPU, Memory, and Session Counts On Your RDS Servers Over Time

Historical Performance And Load Across the Farm (2)
Pinpoint Times of High Resource Utilization on RDS Session Hosts.

Historical Performance And Load Across the Farm (3)

Review Which Users Caused High Resource Utilization
After Clicking On a Timeframe of High Resource Utilization, Immediately See Which Users Impacted the Session Host(s) Most.

Quickly Filter Dashboards By Date Range and RDS Collection Name / Server Groups

For organizations with larger RDS deployments, attempting to review all of the session host servers in a single dashboard can get complicated. Version 4 of Remote Desktop Commander allows you to quickly filter dashboards by an 1.) RDS collection name, 2.) a user-defined group of RDS servers, and 3.) in some cases, a date range lookback. By doing so, you can keep multiple dashboards up and running inside the Remote Desktop Commander Client, with one dashboard per RDS collection.

Filter Dashboards By RDS Collections
Limit the Scope of Session Hosts Shown in Dashboards By Filtering By Collection Name or Computer Grouping.

Filtered Dashboard By Computer Group
A Dashboard With Fewer Elements Filtered By RDS Collection Name / Computer Group

Azure and Standard SQL Server Authentication Support

Previous versions of Remote Desktop Commander required use of a local SQL Server deployment with Windows Integrated Authentication. Version 4 now also allows you to use a.) an on-premise SQL server with Standard (explicit username/password) Authentication and/or b.) a Microsoft Azure SQL Server deployment. This provides organizations with the flexibility to create multiple SQL databases for multiple RDS deployments on a single SQL Server, even when each deployment is isolated in a different, non-trusting Windows domain.

Now Use Standard SQL Connections and Azure SQL Connections to Store and Review RDS Data

Other Performance Improvements

In addition to the features listed above, we’ve made many other performance improvements and bug fixes in this version. Stay tuned for our official launch announcement shortly!

Filed Under: Software Releases Tagged With: RDS Collection, RDS Performance Monitoring, Remote Desktop CPU, remote desktop management, Remote Desktop Memory, Remote Desktop Services, Terminal Server monitoring

Automating Microsoft SPLA Reporting With SPL Tracker – Part 1

May 29, 2014 By admin Leave a Comment

Automate SPLA ReportingSPLA reporting is an expanding and increasingly complicated need as cloud and subscription-based solutions become more prevalent in Microsoft Windows environments.

And Really, It Isn’t Just About SPLA Reporting

In addition to Microsoft’s Service Provider License Agreement (SPLA), there is the Citrix Service Provider licensing program as well. Those aren’t the only two examples where subscription-based license reporting is necessary – more and more software vendors that cater to the Managed Service Provider (MSP) community are also offering this form of licensing.

As a result, one of the monthly chores that can considerably complicate the life of an MSP is recurring, subscription-based license reporting.

While monthly subcription based licensing greatly reduces startup costs and large, capitalized expenses, the reporting requirements can be challenging. Every month, the MSP must provide a report to various licensing authorities based on the number of users who used, or more frequently, had the ability to use specific classes of software.

This gets very tedious and labor intensive for MSPs. Some will attempt to script a solution, others will do simple counts based on AD membership or equivalent. However, both of these approaches are problematic, and they do not reflect total costs or utilization rates over time.

SPL Tracker for SPLA Reporting and More . . .

Our new Service Provider Licensing Tracker (SPL Tracker) is a powerful and cost-saving solution for this specific challenge. Leveraging the software usage history and RDS/ICA usage history collected by our Remote Desktop Reporter tool, the SPL Tracker can analyze the difference between actual usage and ability to use certain classes of licenses.

Best of all, it only takes a few steps to configure, and once configured, can completely automate your SPLA reporting and similar MSP license reporting requirements.


Two classes of license types are shown in this screenshot from SPL Tracker, an SPLA reporting software.
SPL Tracker targets the increasing need for SPLA reporting. Above, two classes of license types are shown – Microsoft Office Users and Remote Desktop Users.

Step 1: Defining License Types

By default, two of the most common license classes are defined for you automatically in the software – Microsoft Office Users, and Remote Desktop Users.

Microsoft Office Users

This class represents all users who have accessed Office components (e.g. Microsoft Word, Microsoft Excel, etc) in your shared computing environment, based on Remote Desktop Reporter’s usage history.

Remote Desktop Users

Similarly, the Remote Desktop Users class represents all users who established an RDS or Citrix XenApp session in a given time period.

Additional Definitions / Classes

You can create additional definitions to track the usage of other applications – those that access SQL Server, for example. Simply create a new license type definition, select the processes that reflect the usage, and save it for later use.

Keep in mind that you can automatically omit disabled user accounts from reports. And, you can also prevent the SPL Tracker from marking newly on-boarded user accounts in a client’s Active Directory as inactive.

Upcoming Insights on SPLA Reporting and More . . .

In Part 2 of our Service Provider Licensing Tracker series, we will demonstrate how to correlate historical license usage with the Active Directory groups that control access to those license types.

Do you have questions about what you’ve read here? Respond below!

Filed Under: Software Releases Tagged With: Citrix, MSP, SPL Tracker, SPLA reporting

  • « Previous Page
  • 1
  • 2
  • 3
  • Email
  • LinkedIn
  • Twitter
  • YouTube

Not Sure Where To Start?

In just a few moments, you can find the right fit of solutions and even services for your needs.

> Get Going Now.

Help Documents

Remote Desktop Commander
Help and Users Guide
Release Notes (ver 8.x)

Sign Up for Remote Desktop Tips and RDPSoft Updates

Blog Topic Categories

  • Azure RemoteApp
  • Azure Virtual Desktop
  • citrix edgesight
  • Citrix Shadowing
  • Cloud RDP Monitoring
  • Performance
  • RDP Disconnects
  • RDP Logs
  • RDP Security
  • RDS Infrastructure
  • RDS Licensing
  • Remote Desktop Bandwidth
  • Remote Desktop Management
  • Remote Desktop Memory Usage
  • Remote Desktop Monitoring
  • Remote Desktop Protocol
  • Remote Desktop Reporting
  • Remote Desktop Services
  • Remote Desktop Services Free Tools
  • Server 2012 TSAdmin Replacement
  • Shadow User
  • Software Releases
  • SPLA Reporting
  • Synthetic RDP
  • Sysmon
  • Terminal Server Monitoring
  • Uncategorized
  • User Activity Monitoring
  • User Productivity
  • User Profiles
  • Windows 2008 Terminal Server
  • Windows Virtual Desktop
  • XenApp Reporting

Recent Posts

  • AVD Monitoring
  • How to Optimize AVD Digital Employee Experience
  • Remote Desktop User Activity Monitoring
  • Remote Desktop Commander Suite v8 Now Available!
  • Remote Desktop Commander Suite v8 Beta Details, Plus a New Solution to Limit Local Admin Rights in EUC

From the RDPSoft Blog

  • AVD Monitoring
  • How to Optimize AVD Digital Employee Experience
  • Remote Desktop User Activity Monitoring
  • Remote Desktop Commander Suite v8 Now Available!
  • Remote Desktop Commander Suite v8 Beta Details, Plus a New Solution to Limit Local Admin Rights in EUC
  • Email
  • LinkedIn
  • Twitter
  • YouTube

We Do “Single Pane of Glass” Monitoring and Management for RDS

Top Level Deployment Dashboard

One of the biggest criticisms leveled against Microsoft's Remote Desktop Services as an end user computing (EUC) platform is its complete lack of integrated management and monitoring tools. … Learn more about our centralized RDS monitoring and management >

Reach Out

For fastest response, reach out via our sales and support contact forms.

Sales
US: 1-855-738-8457 x1
Outside the US: 1-702-749-4325 x1

Support
for Evaluators and Priority Support Customers
US: 1-855-738-8457 x2
Outside the US: 1-702-749-4325 x2

© Copyright 2013–2026 RDPSoft. All Rights Reserved. RDPSoft is the sole authorized publisher and distributor of the following software titles: Remote Desktop Commander, Premium Management Features, Remote Desktop Canary · Sitemap