
Greetings, loyal customers! We now have a stable beta of Remote Desktop Commander Suite v6 we’d love for you to test and give us feedback on. There are two download links below – one for the full RDC Suite installer package, and another for the upgrade only installer package. Please read all of our recommendations before proceeding with one of the downloads below.
Where Should I Install This Beta?
In an ideal world, you will install it on a separate VM with its own instance of SQL, and then monitor a separate test RDS collection in your environment. That being said, we know some of you may wish to upgrade your existing Version 5.x release in place to monitor a production environment. We have done extensive testing in our lab environments, and while we feel that this Version 6 beta is quite stable, especially around the Remote Desktop Reporter service (its data collection engine), we obviously cannot guarantee a bug free experience, and so if you do encounter some bugs, it may be several weeks until they can be addressed in the commercial release due out in early April.
What Are the New Features / What Should I Test?
There are many new features and reports in Remote Desktop Commander V6. These new areas are also the most likely to have bugs as they represent new code. Here are all the new features you’ll definitely want to explore and test:
The Top Level Deployment Status Dashboard
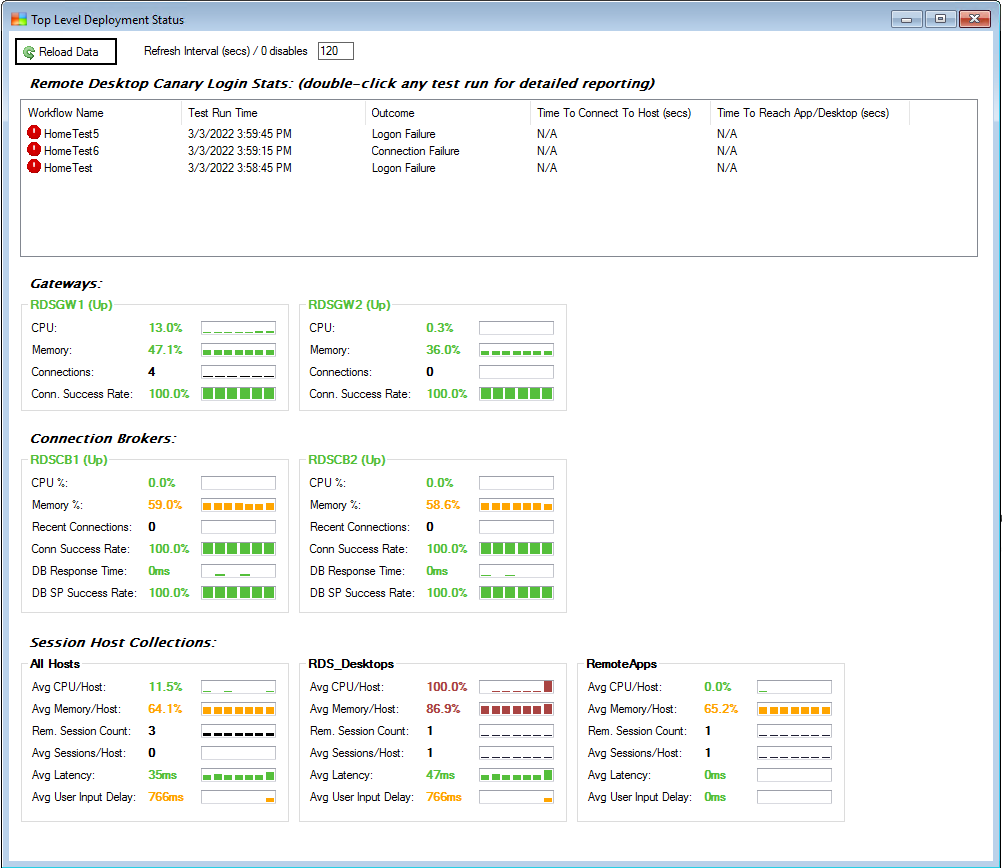
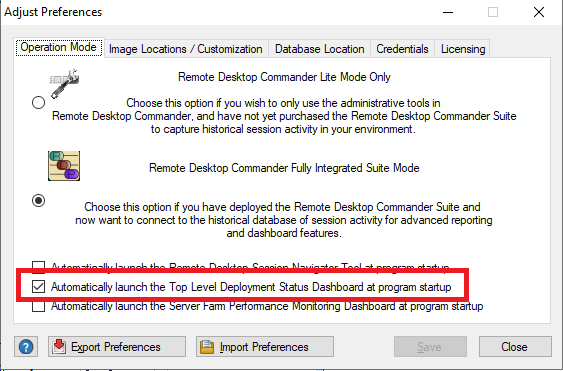
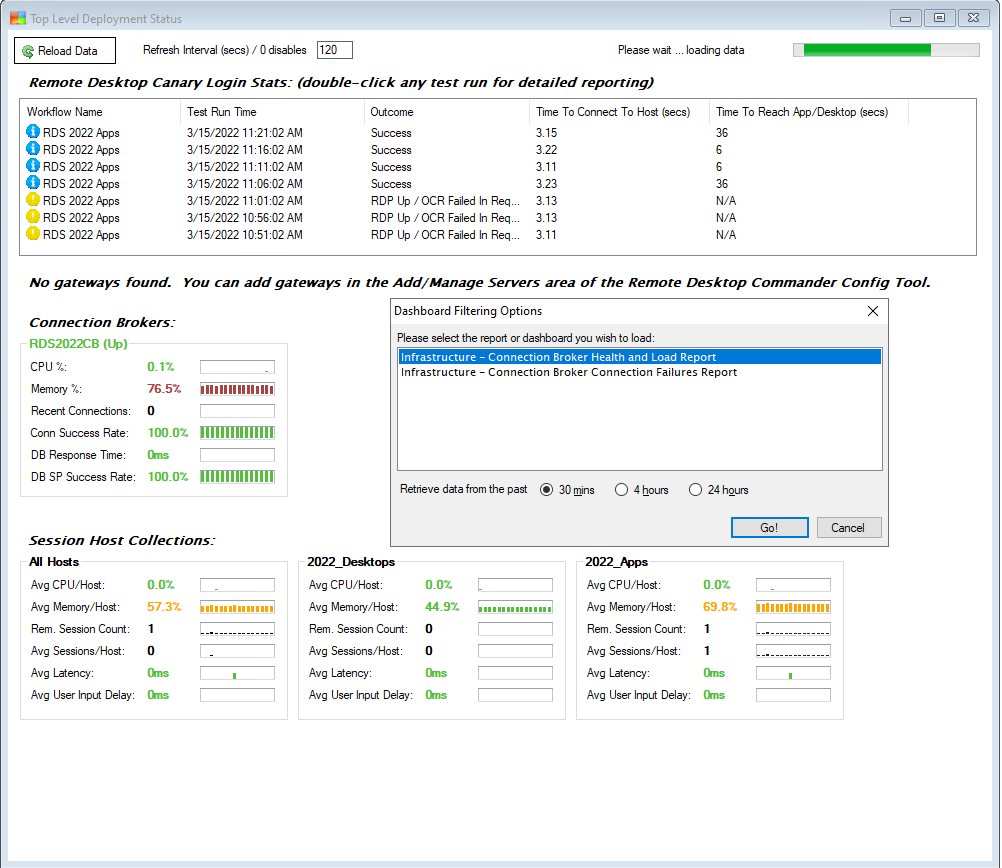
Under the Reports and Dashboards menu of the new Remote Desktop Commander Client, you will find an entry for the Top Level Deployment Dashboard. You can set this to be the default “startup” dashboard every time you load the client by going to the File Menu->Application Preferences and Licensing Area. If you are managing a large RDS deployment, switching to this dashboard will make monitoring your RDS deployment easier. Trends across collections and infrastructure servers will be simple to spot, and this new dashboard typically loads and refreshes faster than the older Current Performance and Load Across the Farm Dashboard.
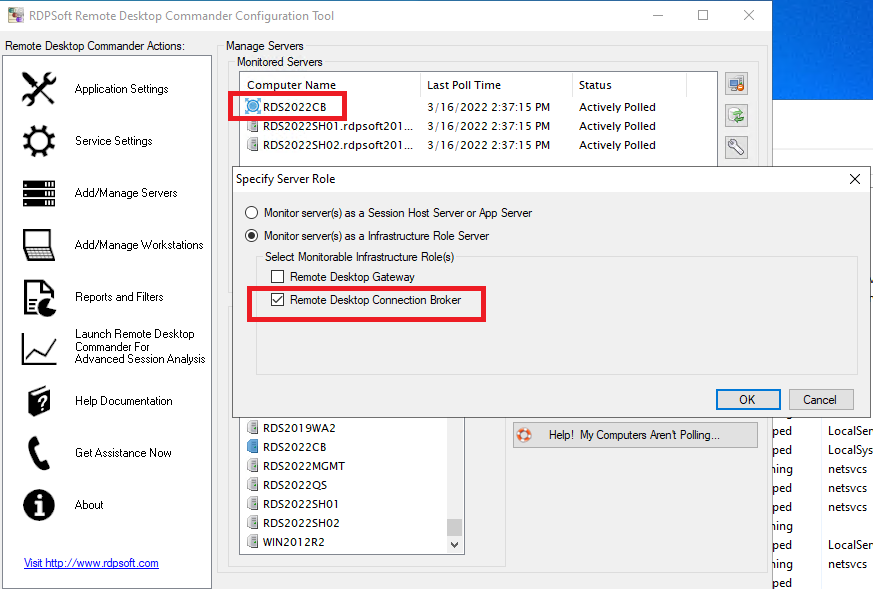
In order to see all of your infrastructure role servers in this dashboard, you need to add them successfully in the Add/Manage Servers area of the Remote Desktop Commander Configuration Tool. No worries if you don’t have gateways or if you don’t have brokers deployed in your environment, what you don’t use simply won’t be a part of the dashboard. If you have not already been monitoring your connection brokers, you will need to add them in the Add/Manage Servers area of the Remote Desktop Commander Configuration Tool. They will then show up with a special icon.
Once all of your brokers, gateways, and session hosts have been added in the Add/Manage Servers area, give our software a few polling cycles to collect data before launching the Top Level Deployment Status Dashboard. If you still don’t see everything you expect to, restart the Remote Desktop Reporter service, and also make sure that the Remote Desktop Reporter Service account is an administrator on all the brokers, gateways, and session hosts you are monitoring. Furthermore, if the Windows Firewall is enabled on those servers, make sure you’re allowing exceptions for WMI, Remote Event Log Management, and Remote Service Management.
Once you’ve got data populating into this dashboard, you can click on any of the displayed items (e.g. labels, trending sparkline graphs, etc) to raise a “chooser” dialog that in turn will raise other dashboards or build reports based on recent data, so you can dive in deeper to investigate an issue. You can can even launch an RDP admin session directly into a broker or gateway server if it’s misbehaving!
Remote Desktop Canary Integration
Version 6 of Remote Desktop Commander offers direct integration with Remote Desktop Canary. Specifically, Remote Desktop Canary can be configured to send its alerts to the special RemoteDesktopCanaryStatsv2 table that is included in the latest Remote Desktop Commander database, or you can configure Remote Desktop Commander to connect to an external Remote Desktop Canary SQL database to consume events. Once this is done, Remote Desktop Canary alerts will display across the top of the Top Level Deployment Status Dashboard, and Remote Desktop Canary reports can be generated on a manual or scheduled basis.
More information on this integration can be found by pressing F1 in the Top Level Deployment Status Dashboard to raise context sensitive help. The area where you can go to link Remote Desktop Commander to an external Remote Desktop Canary SQL database is located in the Remote Desktop Commander Configuration Tool here:

New Reports
Remote Desktop Canary v6 offers 6 new reports in a new “Infrastructure” category. Most of these can be raised directly from the Top Level Deployment Status Dashboard, but you can also schedule them on a daily basis. Please do test them both on a manual and scheduled basis.

Better Report “Quick Filtering”
In previous versions of Remote Desktop Commander, if you wanted to filter a report by user(s) or computer(s), you would need to first define a filter. Only then could you apply it.
In Remote Desktop Commander v6, when you select the “Run Report” button, the top selection allows you to select a time range but also allows you to quickly pick users or computers you want to filter by. This is a great new feature for larger environments as you can quickly investigate an issue happening on specific servers or to specific users.

A New “Turbo Mode” For Our Agent Service
We have made some optimizations in Version 6 of the Remote Desktop Reporter Agent Service when running on terminal servers under high CPU load. We call these optimizations “Turbo Mode,” and when enabled, it makes our agent service’s threads yield less of the CPU when collecting new data. This may result in slightly higher CPU consumption on the session host, but on a highly tasked session host, it may be required in order for our software to timely collect and transfer agent data back to the master Remote Desktop Reporter Service.
If you wish to enable and test “Turbo Mode,” first install Version 6 of the agent service on your hosts. You can do that by running the new agent installer package located under \Program Files (x86)\RDPSoft\Remote Desktop Commander\AgentInstaller on your hosts, exactly as you have done before during prior upgrades. The new agent installer will upgrade any older version of the agent service to the new version in place.
Once that is done, if you wish, you can reconfigure the new agents on your hosts to use Turbo Mode by running the Polling Rate & Agent Tuning Wizard in the Remote Desktop Commander Configuration Tool, like so:

Disabling the Capture of Certain Collected Metrics
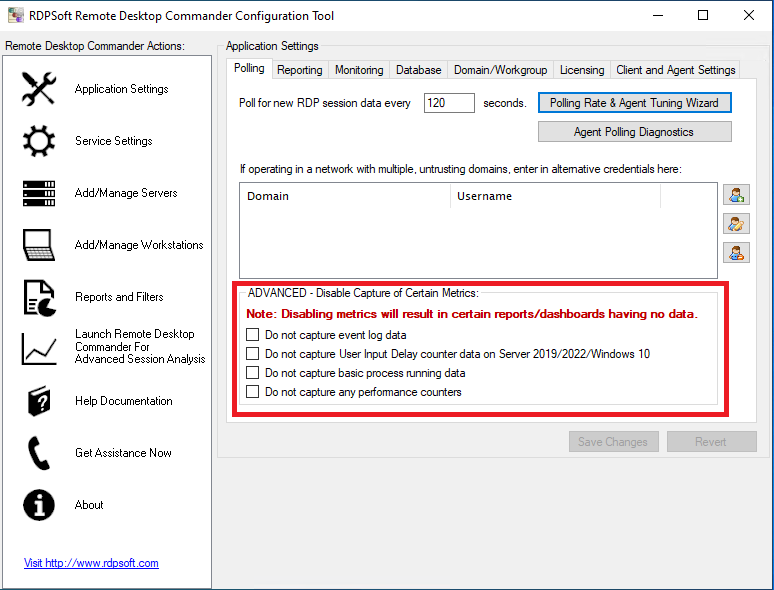
For certain organizations with exceptionally limited database space, or massive RDS deployments, you can now tell the Remote Desktop Reporter Service to NOT capture certain types of metrics from hosts during its polling. In general, we recommend that you do not disable capture of metrics unless absolutely required, as this will result in some specific reports and dashboards showing incomplete or missing data. That said, disabling some or all of these metrics will result in faster polling of servers and a reduction of data in your database. Should you have any interest in doing so, please contact RDPSoft’s support team before proceeding.
Download Links
Full Installer Download
If you would like to deploy a brand new instance of the beta on a new virtual machine and SQL instance, please download the full Remote Desktop Commander Suite installer here:
RDCommanderSuite.exe – v6 Beta (348 MBs)
Upgrade Installer Download
If you would like to upgrade your current installed version to the V6 beta (again, please see our disclaimer about potential bugs above), please download the Remote Desktop Commander Suite upgrade installer here:
RDCommanderSuiteNoPreReq.exe – v6 Beta (132 MBs)
Upgrade instructions can be found here. HOWEVER, don’t download the upgrade installer from this upgrade instructions page, as it is for version 5.1. Download the v6 beta upgrade installer shown above on THIS page.
Beta Feedback and Bug Reports
Please send in all feedback regarding the v6 beta, including bug reports, using our online support form. Thank you!
