Greetings, loyal customers! Please read on to learn how to take advantage of the new RDPSoft Client Side Diagnostics features available in Version 8, in order to better troubleshoot problems with remote end user endpoints connecting to RDS, AVD, or Parallels RAS environments.
What Are the New Features and How Do I Access Them?
The primary new feature in v8 is the ability to collect and review client-side endpoint metrics from any Windows 10 PC (Intel only supported) or Windows 11 PC (Intel and ARM64 supported) that is connecting into your RDS, AVD, or Parallels RAS environment, using the new Digital Employee eXperience (DEX) dashboard in the Remote Desktop Commander Client.
Accessing these metrics from our client’s DEX dashboard requires two prerequisite steps to be performed first.
Step 1 – Deploy the Client-Side Diagnostics Agent to Each Session Host Where Clients Connect
The new Remote Desktop Commander Client Side Diagnostics Agent is a set of very small and highly efficient processes that are automatically loaded into any new RDS or AVD session when a user connects to a session host. Collectively, they should not take up more than 2 to 3 MBs of memory in each user session. When a client connects to a session host running these components, these processes running server side will check to see if the client PC has the RDPSoft Client Diagnostics package loaded on the far end of the connection. Later, if prompted by the DEX dashboard, these server-side components will open a secure and separate communication channel to the client over the RDP protocol to request and retrieve that data.
The easiest way to deploy these components is to use the Remote Desktop Commander Agent Deployment and Tuning Wizard. This wizard uses Powershell Remoting / Windows Remote Management (WinRM) to install agent components to your session hosts. You’ve probably already used this wizard to deploy or update our existing server-side performance & session recording agent.
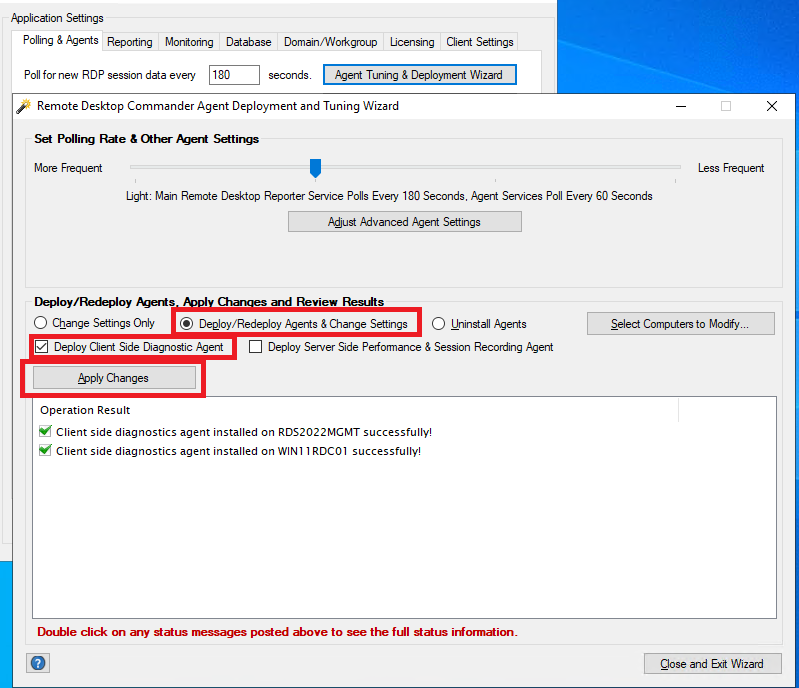
To push out the new Remote Desktop Commander Client Side Diagnostics Agent, raise the Agent Deployment Wizard, chose “Deploy/Redeploy Agents & Change Settings,” and check the “Deploy Client-Side Diagnostic Agent” option – you can also choose to update or deploy the Server Side Performance and Session Recording Agent if you wish. Then click “Apply Changes.” In a moment, you should see the wizard come back with the status of the deployment to all of your session hosts. Note that this does not require a restart of your session hosts, the components immediately become active when a user logs back in or reconnects to their session on the host.
Please note, you can also reverse this process and remove the Client Side Diagnostic Agent from your session hosts by using the “Uninstall Agents” with the “Uninstall Client Side Diagnostic Agent” option selected in the same manner.
If WinRM is disabled, or if you have DevOps procedures in place with a Golden Image for your session hosts, you can also install the Client Side Diagnostic Agent via a standalone installer. This standalone installer is the rdcclientsidediagagent.exe program located under the \Program Files (x86)\RDPSoft\Remote Desktop Commander\AgentInstaller directory.
Step 2 – Create a RDPSoft Client Side Diagnostics Installer Package, and Distribute It To End Users Whose Connections You Wish To Troubleshoot
As previously mentioned, there also needs to be components loaded on end user Windows PCs which will communicate with the session hosts over the RDP channel and send the client-side information upstream for analysis.
The first part in this process is creating a micro installer package the end user runs on their PC. It’s important to note that the micro installer you create here does not require that the end user have admin rights (standard user rights are fine), nor does it require formal installation rights on the PC either (e.g. access to the Windows installer). All components are installed in their local user profile and local user portion of the registry. This was a deliberate design choice we made to make things as easy as possible on the end user.
All they need to do is double-click to run this micro installer on their PC, and in a few seconds, everything will be installed. After it runs, have them logoff (or even just disconnect) from their RDS or AVD environment, and then reconnect. Then, all needed communication channels will be successfully established between the client PC and the session host.
These client-side components have been tested and load properly with MSTSC (RDS), the legacy AVD client (Remote Desktop w/MSRDC), the current Windows App, and the Parallels RAS client for Windows.
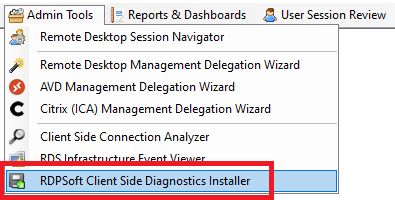
To create the micro installer, first launch it from the Admin Tools menu:
Then, enter the behavioral properties for how you want it to work. Selecting each property will show you what it controls below. We recommend initially that ContinuousNetPoll be set to False, PollLongWait be set to 90 seconds, Server1 be set to a reference pingable host on the Internet you want to compare to your VPN, RDS, or AVD gateway server (e.g. 1.1.1.1, 8.8.8.8), and Server2 be set to your pingable VPN, RDS gateway, or AVD gateway. If you are using AVD, the hostname for the nearest geographic AVD gateway is always rdweb.wvd.microsoft.com.
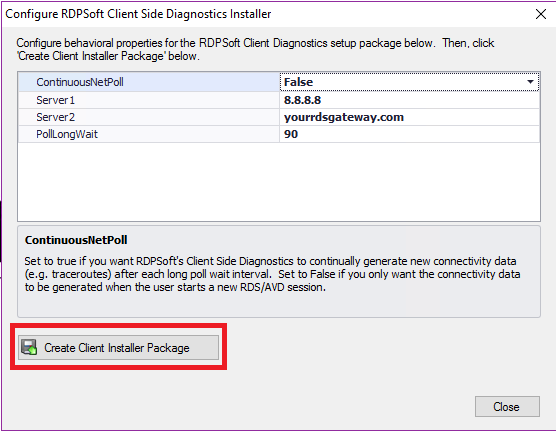
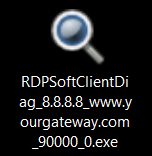
Once done, click the “Create Client Installer Package” and choose a folder where to store it. Do NOT change the filename before distributing it to the user, as the filename contains the behavioral properties within it which will control its operation.
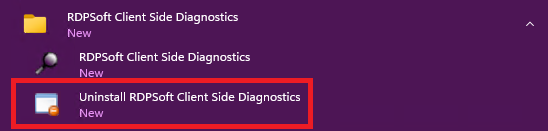
Once the end user runs this micro installer on their remote PC, they simply need to disconnect and reconnect to your remote environment for the client-side diagnostics to become available in our DEX dashboard. If there are any issues, or if the user no longer needs troubleshooting, the components can be deregistered and uninstalled from the Start Menu as shown here:
Accessing Client Side Metrics in the New DEX Dashboard
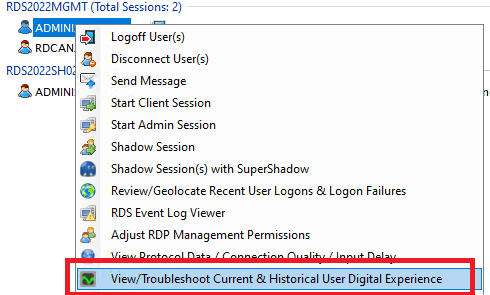
Once the Client Side Diagnostics Agent has been deployed to your session hosts and once end user(s) have run the micro installer on their PCs, you can view and retrieve client-side performance metrics from the DEX dashboard. To do so, find their live session in the Remote Desktop Session Navigator, right mouse click, and raise the DEX dashboard.
From here, you should see the Client Side Metrics from the end user’s PC in the lower section of the dashboard.
Please note, in order to access these metrics, you must have admin rights on the session host they are connected to.

Here are the client-side metrics you can review for troubleshooting in the dashboard:
WiFi Strength – If the user has a hardwired connection to the local network, this area will show Wired and the graph will indicate 100%. If the user has a wireless connection to their local network, it will display the WiFi signal strength percentage (0% to 100%). Signal strengths less than 50% could be the cause of frequent user disconnects and other issues.
Client Memory Load – This displays the percentage of memory currently utilized on the client endpoint across all programs running on that PC.
Client CPU Load – This displays the percentage of CPU currently utilized on the client endpoint by all programs running on that PC.
View Advanced Performance Stats – Click this button to launch the Advanced Client Peformance Stats dialog, which displays the Top 5 processes running on the client PC that are consuming the most CPU, the most memory, and the most disk or network IO respectively.
Please note that these processes reflect only the processes in that user’s local session under their direct control that they have the rights to profile and does not reflect system processes or services.
View Advanced Network Stats – Click this button to generate and collect differential traceroute and other network data from the client PC to the two network addresses you specified when building the Client Side Diagnostics micro installer you distributed to your end user(s). Please note, this may take a while to generate (e.g. a minute or more), as traceroutes take a while to build.

Final Notes
1.) At this time, support for collecting client side metrics are supported on:
Windows 10 x64 bit (Intel only)
Windows 11 x64 Bit (Intel and ARM64 are supported)
*Mac, Linux, and Android clients are currently not supported
2.) If you would like to upgrade the Remote Desktop Commander Client on other systems where admins or help desk staff are accessing it (e.g. as published RemoteApps or on a JumpBox system), you can obtain the v8 Client installer rdcommanderlite.exe from the \Program Files (x86)\RDPSoft\Remote Desktop Commander\ClientInstaller folder. Then, transfer it to the systems running the v7 client, log into those systems with admin rights, and run the v8 client installer on those systems to upgrade them in place.
