RDPSoft

Remote Desktop and Terminal Server Software

We Monitor, Manage & Fix RDS, AVD, Citrix and Parallels RAS
  • Products / Services
    • Not Sure Where To Start?
    • The Complete Monitoring and Management Bundle For End User Computing
    • RDS / AVD Monitoring & Reporting
      • Remote Desktop Commander Suite
      • Sysmundo
    • RDS / AVD Management and RMM Tools
      • Remote Desktop Commander Lite (Free RDS/AVD Management Tool)
      • Remote Assistance RMM Tool + Delegation of Management for RDS/AVD Support Desk
      • Automatic Resolution of Locked Profiles and Stuck Sessions
    • RDS/AVD Synthetic Login Monitoring / Connection Time / Uptime Monitoring Tools
      • Remote Desktop Canary
    • RDS/AVD/Citrix Profile and Session Problem Remediation
      • Fix My Session
    • Digital Forensics and Incident Response Tools
      • Sysmundo
    • Consulting and Professional Services
      • RDS Performance Audits, Security Audits, and General RDS Consulting
      • Custom Report Design Services
      • Training and Other Professional Services
  • Download
    • RDC Lite: Free RDS/Citrix Session and Farm Manager
    • RDC Lite With Premium Management Features
    • RDC Suite: Installer and Release Notes
    • Remote Desktop Canary – Request a Demo/Trial
    • Sysmundo
    • Request Upgrade To New Version
  • Buy
    • The Complete RDS/AVD Monitoring and Management Bundle Purchase Options
      • Start Monthly Subscription Now
      • Start Annual Subscription Now
    • Remote Desktop Commander Suite Purchase Options
      • Start Monthly Subscription Now
      • Start Annual Subscription Now
      • Buy Perpetual License(s)
    • Premium Management Features Purchase Options
      • Start Monthly Subscription Now
      • Start Annual Subscription Now
    • Remote Desktop Canary Purchase Options
      • Start Monthly Subscription Now
      • Start Annual Subscription Now
    • Fix My Session Purchase Options
      • Start Monthly Subscription Now
      • Start Annual Subscription Now
    • Sysmundo Purchase Options
      • Start Monthly Subscription Now
      • Start Annual Subscription Now
    • Buy Incident Based Support Packages
    • Pricing
  • Blog
  • Support
    • Contact Support / Submit Ticket
    • RDPSoft Knowledge Base
  • Contact
  • Partners

Three New Ways to Report on Remote Desktop Performance

December 15, 2014 By admin Leave a Comment

Last week we explored the addition of the Remote Desktop Reporter Agent and Analysis Client available in Remote Desktop Reporter 2.7. But wait! There’s more when it comes to this most recent release of Remote Desktop Reporter.

New Reports Target Remote Desktop Performance

We’ve also added three new – and frequently requested – reports to our stable of over 60 reports encompassing all aspects of user session activity and performance metric tracking. These three specifically focus on Remote Desktop performance.

Program Run Times By User

This report offers a breakdown of how long different applications are run by different users. Pairing this report up with filters on process names and users, you can quickly determine how long specific programs are being run in sessions compared to others. MSPs can also use this report to create metered billing solutions for the use of specific programs.
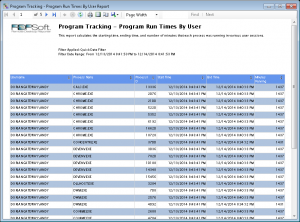
Program Run Times By User Report
Program Run Times By User report screenshot.

Session Reconnect Attempts

Now you can quickly highlight specific users from specific clients that have had frequent reconnection tries to servers in specific hours of the day. Review this report regularly can highlight connectivity issues either on specific servers, or more likely, on specific clients.
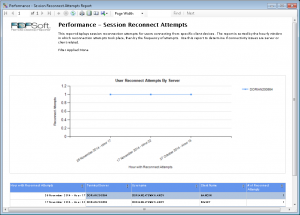
Session Reconnect Attempts Report
Frequent reconnection attempts are a Remote Desktop performance red flag. This is a screenshot from the Session Reconnect Attempts report.

CPU and Memory By Session

Ever need to quickly highlight CPU and memory consumption by user session on each server? If not, you will. This report mimics a dashboard in the new Analysis Client, which shows average, maximum, and minimum CPU and memory usage for each recorded session. Use this report to spot outliers (such as high CPU or memory use), which you can further investigate in the Analysis Client to find out what behaviors or applications caused high utilization of CPU and/or memory, in order to prevent them from taking place in the future.
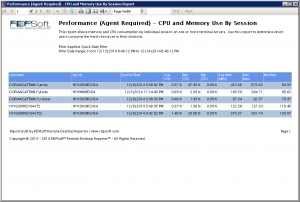
CPU And Memory Use By Session Report
Screenshot from the CPU And Memory Use By Session report.

See These Reports in Action For Yourself

In addition to these three Remote Desktop performance reports, there is so much more now appearing in Remote Desktop Reporter 2.7 and later. Free trial software is available for download from our web site, and pricing remains highly competitive. Do you have a question about other reports available in Remote Desktop Reporter? Just ask below.

Filed Under: Remote Desktop Reporting Tagged With: metrics, remote desktop performance, remote desktop reporting, Terminal Server performance

About Our Remote Desktop Reporter Agent and Analysis Client

December 10, 2014 By admin Leave a Comment

The centerpiece of Remote Desktop Reporter 2.7 is the addition of the brand new Remote Desktop Reporter Agent, coupled with the new Analysis Client. Past versions of the software have been agentless, and that capability is preserved in the new release for those who do not need the new expanded feature set.

What the Addition of the Remote Desktop Reporter Agent Means

In the past, with its agentless architecture, Remote Desktop Reporter collected and warehoused user session information from Remote Desktop servers, VMWare Horizon View servers, and Citrix XenApp servers.

But, the Remote Desktop Reporter Agent enables the gathering of an enhanced set of metrics as well as collecting the same types of metrics from physical desktops and any desired virtual desktops.

For Example, Remote Desktop Reporter Can Now . . .

The new capabilities made possible by both the Remote Desktop Reporter Agent coupled with the Analysis Client are expansive.

CPU and Memory

Remote Desktop Reporter can now show administrators how much of the CPU and memory individual sessions are consuming. This can be shown both in aggregate and by the minute.

Memory and CPU By Session Dashboard
Memory and CPU By Session Dashboard as shown in Remote Desktop Reporter.


Recorded Session Memory and CPU Slices

Screen Captures

Periodic screen captures can be recorded for later review, so that administrators can see what programs in sessions are connecting to what sites and over what ports they are connecting.

Recorded Session Screenshots

TCP/UDP Connections By Session and By Process

The Remote Desktop Reporter Agent can be configured to capture all open TCP/UDP connections made by applications running in user sessions. Administrators can then search for sessions with activity over a specific port number, and find out exactly what application was the culprit.

Session Search By Port Activity

Tested, Reliable Database Storage

All of this data is indexed in a database so administrators can search for sessions that match chosen criteria – application name, port usage, or application window title, for example. And just like previous versions, you can leverage the free, built-in Microsoft SQL Server Express DB instance for smaller deployments or scale up to limitless data retention with the full version of Microsoft SQL Server.

Time Tracking Data

Management can get valuable time tracking information based on computing resources that are being used – whether on-premises or cloud.

Root Cause Performance Analysis

Administrators can quickly prepare a root cause analysis on problems that crop up on multiple SBC platforms – enabling them to drill down to a specific program in a user session.

Remote Desktop Reporter Capabilities Expand While Pricing Stays Within Reach

RDPSoft remains committed to putting quality tools in the hands of the SMB community. All the while, pricing remains well within reach. And, free trial software is always available.

Have you worked with the new release of Remote Desktop Reporter yet? Do you have questions about what Remote Desktop Reporter can do for you? Share your thoughts with us . . . 

Filed Under: Remote Desktop Reporting Tagged With: agent, agentless, remote desktop, remote desktop reporting, telecommuters, teleworkers

Tracking RDP Bandwidth on Windows Server 2012: An Update . . . Is a Hotfix On The Way?

January 28, 2014 By admin Leave a Comment

A few weeks ago, in a blog post titled Want to monitor RDP bandwidth by user on Windows Server 2012? You’re out of luck…, we exposed the fact that the API function calls and Performance Counter metrics that used to provide per session RDP bandwidth consumption no longer worked and/or had gone missing.  At that time, we speculated that this was a result of “plumbing changes” to the Remote Desktop Services code base to add greatly enhanced RemoteFX support in Windows Server 2012.

We finally have more information, and if you need to reliably track RDP bandwidth consumption by client or by session, you’ll want to read on . . .

RemoteFX Plumbing Woes

It turns out, we were right. 🙂

Windows Server 2012 Plumbing Changes Affect Tracking RDP Bandwidth
The plumbing changes that occurred in the Remote Desktop stack in Windows Server 2012 dramatically impacted the ability to track RDP bandwidth.

After much back and forth with a highly professional Microsoft support representative, it was determined that the plumbing changes in the Remote Desktop stack to enhance RemoteFX in Windows Server 2012 were so massive (including moving whole chunks of code out of kernel mode into user mode), they effectively nuked the old API calls and Performance Counters.

Now, as has been mentioned by the distinguished Shawn Bass of the RDS MVP community, there are some new RemoteFX related performance counters that look at bandwidth.  However, these counters look at rate only, and only at bytes transferred/received in the last second.

Therefore, they do not function as before, nor are they a substitute for the old “total bytes transferred/received” counters, because they are not stateful over the life of a particular RDS user session.

Potential Pitfalls Polling Stateless RemoteFX Performance Counters For Bandwidth Data

In order to get anything approaching a total bytes transferred/received count, you literally would have to poll these counters every second, which presents many pitfalls.

  • Dependence on WMI for this data.  Not highly scalable, nor particularly reliable, in our opinion.  Don’t just take our word for it though.
  • Significantly increased bandwidth required during polling.  Pulling multiple performance counters every second over the network adds up quick.
  • No tolerance for any missed polling of data.  Miss a few seconds here or there due to a blip on the network, or the inability to access the counters for whatever reason?  That stateless data is gone, forever, and now your bandwidth tally is inaccurate.  Bad, bad news if you’re an MSP or SaaS provider actually trying to bill or meter users based on bandwidth transfer.

Of course, this doesn’t even cover the tedium of trying to match up the underlying user with a particular Winstation name.

A Hotfix On The Way?  You Might Want To Wait On The Windows Server 2012 Upgrade If You Wish to Track RDP Bandwidth Consumption

Fortunately, there is some good news (for now).  To their credit, Microsoft’s support department has agreed to file for a Hotfix to restore stateful, per-session aggregation of bandwidth metrics back through the API.  The actual release of a Hotfix is by no means assured, as it has to go through multiple levels of approval by the folks in Redmond.

In conclusion:  If you are an MSP or SaaS provider that needs to reliably track RDP bandwidth consumption by client or by session, stay at Windows Server 2008 R2 for a little longer.  This issue, in our opinion, combined with some continued challenges around RemoteFX (which we will write about later), warrants a period of watchful waiting as the Windows Server 2012 offering fully matures.

As soon as we receive word on whether or not the Hotfix will actually be developed, we will update our readership promptly.

In the meantime, if you are an MSP or SaaS over Remote Desktop vendor and would like to find out more about how our Remote Desktop Reporter tool can help you, click on the links above for more details, or contact us by phone to discuss your needs in more depth.

Filed Under: Remote Desktop Bandwidth, Remote Desktop Reporting Tagged With: RDP, Windows Server 2012

SaaS Over Remote Desktop: License and Resource Metering Techniques

December 30, 2013 By admin Leave a Comment

Believe it or not, there’s a nice sized portion of SaaS vendors in the marketplace that are delivering their SaaS applications to clients over RDS (Remote Desktop Services) as opposed to the Web.

Why Remote Desktop and RemoteApp?

There are several reasons many software vendors choose remote desktop (or RDS) and RemoteApp as the mechanism by which to provide their software as a service over the Internet. Here are the big reasons:

  • Inherent limitations in building a web application with a consistent, rich, and responsive user interface.
  • Additional development and QA costs associated with web apps.
  • The costs to migrate an existing non-Internet based application.
  • Security considerations.

But Don’t Forget License and Resource Metering

As we do more and more business with “Saas over Remote Desktop” vendors, one of the biggest problems we see them experience is license and resource metering.

SaaS vendors using remote desktop have some numbers to crunch.
If you’re an SaaS vendor using Remote Desktop to deliver your application, you’ve got some numbers to crunch when it comes to license metering.

It’s one thing to develop and bring a SaaS application to market.  It’s quite another to figure out how to:

  • Capacity plan for additional hardware / virtualized servers in your server farm as your client base grows.
  • Attribute costs of business to specific clients (How much bandwidth/memory do they use?).
  • Reliably meter client usage of your application for billing purposes . . . and to know when to bump your clients up to the next subscription level based on that usage.

. . . or the Bottom Line

We then help SaaS vendors solve those very problems. As an aggregator of Remote Desktop Session metrics, our Remote Desktop Reporter solution is being used to produce lots of different reports that help a SaaS vendor stay on top of client license and resource usage, and in turn, significantly improve their bottom line.

Some of those metrics include:

  • RDP bandwidth by user.
  • Peak concurrent sessions by server and/or by user.
  • Distinct RDS users by time period.
  • Total time by RDS user.
  • Specific application use by user.

Are You a SaaS Vendor in a Similar Situation?

We can provide a web demonstration of how to configure our software and establish these reports. Reach out to us here or message us on Twitter @RDPSoft.

Or, post a question below and continue the discussion!

Filed Under: Cloud RDP Monitoring, RDS License Metering, Remote Desktop Bandwidth, Remote Desktop Reporting, Terminal Server Logging, Terminal Server Monitoring Tagged With: license metering, remote desktop, resource metering, SaaS

Want to monitor RDP bandwidth by user on Windows Server 2012? You’re out of luck…

December 20, 2013 By admin Leave a Comment

One of the neatest things our Remote Desktop Reporter tool can report on is total RDP Bandwidth consumed in each user session.  Historically, Microsoft has made this data accessible in their operating systems one of two ways:

  1. Through queryable Performance Counters associated with a particular user session
  2. Through the underlying Terminal Services API, also queryable by individual user session

As a result, we gather this information routinely for storage in Remote Desktop Reporter’s database and offer a few out of the box reports to break it down for system administrators.  We also use it in our freeware RDP Bandwidth Monitor Tool, which is part of our complimentary Remote Desktop Admin Toolkit.

You can imagine our surprise when we discovered that these metrics are flat out gone in Windows Server 2012.  Gone, you say?  Yes, entirely.

Terminal Services Session Counters in Windows Server 2008

Let’s first look at the Terminal Services Session counters in Windows Server 2008:

Screenshot from Windows Server 2008
“Add Counters” in Windows Server 2008.

As you can see, we can get RDP Bandwidth oriented information, such as the input/output bytes of a particular RDS Session, with both the compressed and non-compressed variants available.

But, Look at Terminal Server Session Counters on Windows Server 2012 . . .

Now, let’s look at the Terminal Server Session counters from a Windows Server 2012 box:

"Add Counters" screenshot from Windows Server 2012
“Add Counters” in Windows Server 2012.
"Add Counters" screenshot from Windows Server 2012
And something seems to be missing from Windows Server 2012 . . .

The very same RDP Bandwidth counters that were present in Windows Server 2008, and many previous versions, are now gone.

What About the Terminal Services API?

Certainly we can get this sort of information from those functions, right?  Nope.  Calling the appropriate function to obtain these metrics results in the function returning successfully, but with all of these counter values now zeroed out.

It’s like Microsoft literally removed a significant chunk of Performance Counter plumbing out of the RDS subsystem in Windows Server 2012.  We’ve tested both Windows Server 2012 and Windows Server 2012 R2, with exactly the same results.

We have a support ticket open with Microsoft, and the only information we’ve received to date is that “they have researched this and unfortunately the values are no longer supported.  The documentation will be updated accordingly.”

What About an Upcoming Windows Service Pack?

Currently we are requesting possible workarounds from Microsoft to get at this type of information in Windows Server 2012, and/or a possible commitment to add those counters back in an upcoming Service Pack.  We’ll update you with anything we hear in a subsequent blog post.

In the meantime, great RDS community, what’s your theory as to why these counters are missing?  Did the “plumbing changes” to RDS to add/expand RemoteFX in Windows Server 2012 cause the removal of these counters?  Was it a simple development oversight that slipped through QA?

Weigh in with your theories below or tweet us @RDPSoft.

Filed Under: Remote Desktop Bandwidth, Remote Desktop Reporting, Terminal Server Monitoring

  • « Previous Page
  • 1
  • 2
  • 3
  • 4
  • 5
  • Next Page »
  • Email
  • Google+
  • LinkedIn
  • Twitter
  • YouTube

Not Sure Where To Start?

In just a few moments, you can find the right fit of solutions and even services for your needs.

> Get Going Now.

Help Documents

Remote Desktop Commander
Help and Users Guide
Release Notes (ver 6.x)

Sign Up for Remote Desktop Tips and RDPSoft Updates

Blog Topic Categories

  • Azure RemoteApp
  • Azure Virtual Desktop
  • citrix edgesight
  • Citrix Edgesight Replacement
  • Citrix Shadowing
  • Cloud RDP Monitoring
  • DEX
  • Performance
  • RDP Disconnects
  • RDP Latency
  • RDP Login Time
  • RDP Login Tracking
  • RDP Logon Failure Tracking
  • RDP Logs
  • RDP Loss Rate
  • RDP Security
  • RDP Transmission Rate
  • RDS Infrastructure
  • RDS License Metering
  • RDS Licensing
  • Remote Desktop Bandwidth
  • Remote Desktop CPU
  • Remote Desktop Management
  • Remote Desktop Memory
  • Remote Desktop Memory Usage
  • Remote Desktop Monitoring
  • Remote Desktop Performance
  • Remote Desktop Protocol
  • Remote Desktop Reporting
  • Remote Desktop Security
  • Remote Desktop Services
  • Remote Desktop Services Free Tools
  • Remote Desktop Services Hotfix
  • Sensitive Data
  • Server 2012 TSAdmin Replacement
  • Shadow User
  • Software Releases
  • SPLA Reporting
  • Synthetic RDP
  • Sysmon
  • Telecommuting/Teleworking
  • Terminal Server Logging
  • Terminal Server Monitoring
  • Uncategorized
  • User Activity Monitoring
  • User Productivity
  • User Profiles
  • Windows 2008 Terminal Server
  • Windows Virtual Desktop
  • WVD Login Time
  • XenApp Monitoring
  • XenApp Reporting

Recent Posts

  • Fix My Session v1 Now Available!
  • How To Perform User Activity Monitoring in Azure Virtual Desktop
  • Remote Desktop Commander v7 Now Available!
  • How To Deploy Sysmon The Easy Way
  • Remote Desktop Canary v4.0 Now Available!

From the RDPSoft Blog

  • Fix My Session v1 Now Available!
  • How To Perform User Activity Monitoring in Azure Virtual Desktop
  • Remote Desktop Commander v7 Now Available!
  • How To Deploy Sysmon The Easy Way
  • Remote Desktop Canary v4.0 Now Available!
  • Email
  • Google+
  • LinkedIn
  • Twitter
  • YouTube

We Do “Single Pane of Glass” Monitoring and Management for RDS

Top Level Deployment Dashboard

One of the biggest criticisms leveled against Microsoft's Remote Desktop Services as an end user computing (EUC) platform is its complete lack of integrated management and monitoring tools. … Learn more about our centralized RDS monitoring and management >

Reach Out

For fastest response, reach out via our sales and support contact forms.

Sales
US: 1-855-738-8457 x1
Outside the US: 1-702-749-4325 x1

Support
for Evaluators and Priority Support Customers
US: 1-855-738-8457 x2
Outside the US: 1-702-749-4325 x2

© Copyright 2013–2026 RDPSoft. All Rights Reserved. RDPSoft is the sole authorized publisher and distributor of the following software titles: Remote Desktop Commander, Premium Management Features, Remote Desktop Canary · Sitemap