The Version 6.0 release of our Remote Desktop Commander solution offered something for everyone – whether using our free Remote Desktop Commander Lite Client or licensed for our full Remote Desktop Commander Suite.
For instance, here are just some of the notable capabilities:
- The Remote Desktop Commander Suite is packed with expanded capabilities – including an extremely powerful Top Level Deployment Status Dashboard that shows you the health of your Remote Desktop Gateways, Remote Desktop Connection Brokers, and Session Hosts all in an interactive window. This dashboard also integrates with our Remote Desktop Canary product to show current RDS login times in your RDS deployment and alert you to any RDP login issues.
- The Remote Desktop Commander Client has been optimized for additional speed and efficiency when it loads collections full of session hosts.
It’s a lot of content, so here are some links to easily navigate to your specific area of interest:
The Top Level Deployment Status Dashboard
Integrating Remote Desktop Canary With Remote Desktop Commander
Reports for Connection Brokers, Gateways, and Remote Desktop Canary
Quick Filter by User or Computer Name When Manually Running Reports
Introducing Turbo Mode for the Remote Desktop Reporter Agent
Selective Capture of Certain Metrics
User Session Retrieval Speed Improvements for Larger Collections
Need to Monitor Your Connection Brokers? Want to Add Remote Desktop Canary Licensing?
A Note About TechMentor Redmond, August 2022
Version 6.0 Upgrade, Purchase, and Demo Links
Our Top Level Deployment Status Dashboard is the “Single Pane of Glass” RDS Monitoring Dashboard You’ve Been Dreaming About
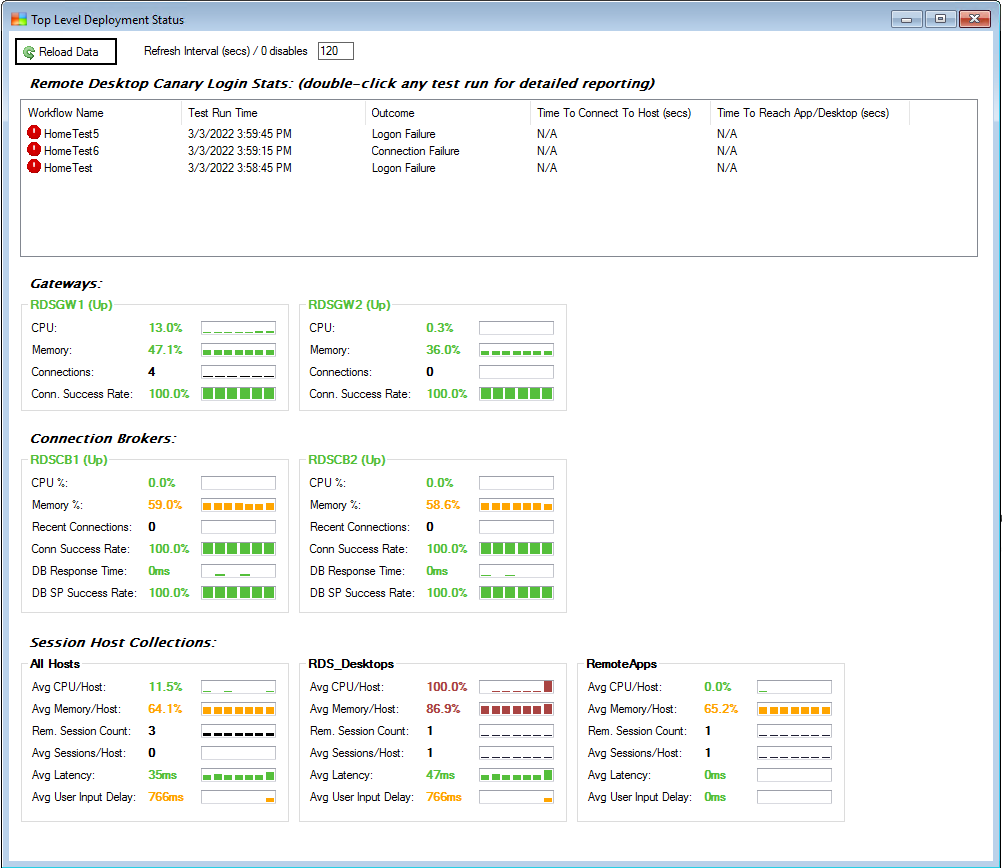

The Top Level Deployment Status Dashboard gives you a comprehensive picture of the health of your Remote Desktop Services deployment, no matter how big or small your environment is. You can see the health of gateways, brokers, and session host collections, and if successfully integrated, also see the login time results of recent Remote Desktop Canary synthetic tests. Clicking on any area of this dashboard raises a menu of sub-dashboards, reports, and other actions, letting you drill down into the data for powerful troubleshooting. In fact, you can drill down all the way into the resource usage of processes or RDP protocol stats in various user sessions.
Watch the video above to learn how to add your connection brokers for monitoring in Version 6+ and how to use the new Top Level Deployment Status Dashboard. Once your gateway and broker role servers are added, data will start populating into this dashboard. You can click on any of the displayed items (e.g. labels, trending sparkline graphs, etc) to raise a “chooser” dialog to drill further into the information collected from brokers, gateways, session hosts, and login times. You can can even launch an RDP admin session directly into a broker or gateway server if it’s misbehaving!
Since Remote Desktop Commander v6+ supports Connection Broker monitoring and Remote Desktop Canary integration, you may want to add more licenses or add the Remote Desktop Canary product to your existing subscriptions.
Don’t forget: It’s worth your time to learn more about why Connection Broker monitoring is so important.
Link Remote Desktop Canary with Remote Desktop Commander for Better Monitoring and Visibility.
Version 6+ of Remote Desktop Commander offers direct integration with Remote Desktop Canary. Specifically, Remote Desktop Canary can be configured to send its alerts to the special RemoteDesktopCanaryStatsv2 table that is included in the latest Remote Desktop Commander database, or you can configure Remote Desktop Commander to connect to an external Remote Desktop Canary SQL database to consume Canary’s login test data. Once this is done, Remote Desktop Canary alerts and login times will display across the top of the Top Level Deployment Status Dashboard, and Remote Desktop Canary reports can also be generated on a manual or scheduled basis.


Reports Track Critical Metrics Related To Connection Brokers, Gateways, and Login Times
Remote Desktop Commander v6+ offers multiple reports in the “Infrastructure” category. Most of these can be raised directly from the Top Level Deployment Status Dashboard, but you can also schedule them on a daily basis.


Be sure to learn more about why Remote Desktop Gateway CAP and RAP failure monitoring is so important.
Reporting by User or by Computer Just Got Even Easier With Quick Filtering
In previous versions of Remote Desktop Commander, if you wanted to filter a report by user(s) or computer(s), you would need to first define that filter. Only then could you apply it to limit the report’s data.
In Remote Desktop Commander v6+, when you select the “Run Report” button, the top selection allows you to select a time range but now also allows you to quickly pick users or computers you wish to filter by. This is a great new feature for larger environments as you can quickly investigate an issue happening on specific servers or to specific users.

Do You Love Redlining Your RDS Session Hosts? Turbocharge Our New Agent Service.
We have added optimizations to the Version 6+ Remote Desktop Reporter Agent Service to help it run more efficiently on terminal servers under high CPU load. We call these optimizations “Turbo Mode,” and when enabled, it makes our agent service yield less of the CPU when collecting new data. This may result in slightly higher CPU consumption on the session host, but on a highly tasked session host, this setting may be required in order for our software to timely collect and transfer agent data back to the master Remote Desktop Reporter Service.
If you wish to enable “Turbo Mode,” first install or upgrade our agent service on your hosts to Version 6. You can do that by running the new agent installer package located under \Program Files (x86)\RDPSoft\Remote Desktop Commander\AgentInstaller on your hosts, exactly as you have done before during prior upgrades. The new agent installer will upgrade any older version of the agent service to the new version in place.
Once that is done, if you wish, you can reconfigure the new agents on your hosts to use Turbo Mode by running the Polling Rate & Agent Tuning Wizard in the Remote Desktop Commander Configuration Tool, like so:

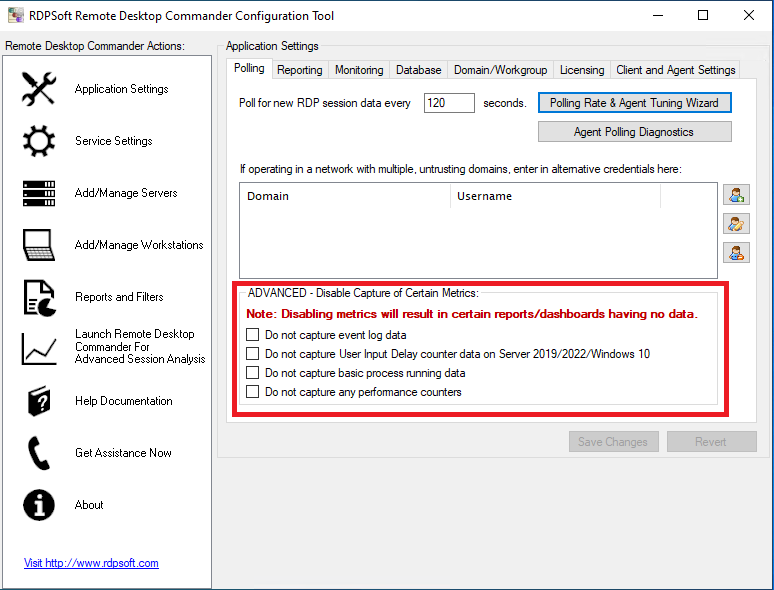
You Can Now Disable the Capture of Certain RDS Related Metrics
Organizations with very limited SQL database space or massive RDS deployments can now instruct the Remote Desktop Reporter Service to NOT capture certain types of metrics from hosts during polling. In general, we recommend that you do not disable specific metric captures unless absolutely required, as this will result in some reports and dashboards showing incomplete or missing data. That said, disabling some or all of these metrics can result in faster polling of servers and a reduction of data in your database. There are also specific use cases where this may be beneficial, such as in organizations who only use Remote Desktop Commander for user activity monitoring time tracking, but nothing else.
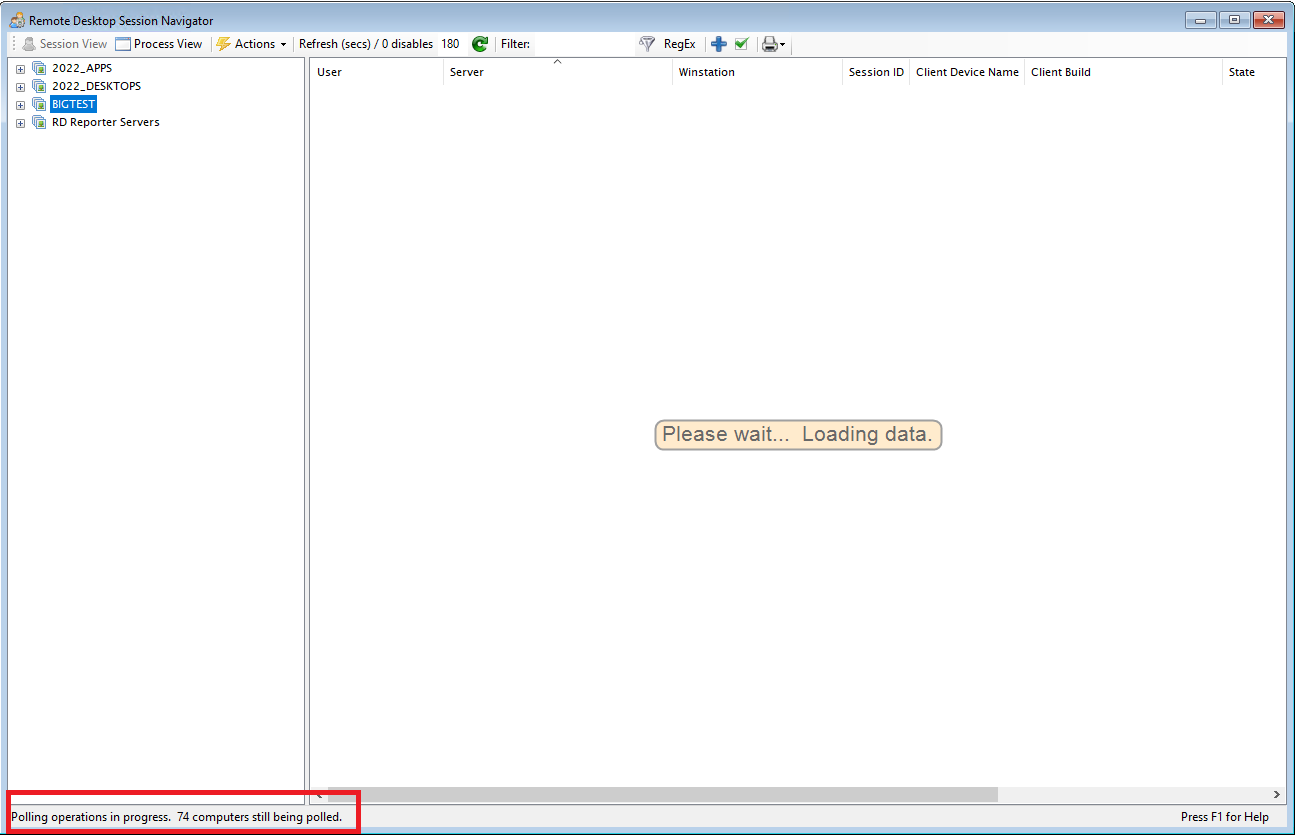
Get a Speed Boost When Managing Extremely Large Session Collections
In version 6.0+ of the Remote Desktop Commander Suite AND Remote Desktop Commander Lite (with or without Premium Management Features), we have optimized some of the algorithms that collect user session and process information. As a result, retrieving or refreshing sessions from RDS collections with 50 or more hosts now can see a 30-50% speed increase.
For example, in our benchmark tests, listing data from 500 user sessions connected to 100 RDS hosts now takes only 11 seconds, down from 20 seconds plus previously. In addition, we have added safeguards to prevent accidental thread reentrance, which in rare cases could cause additional slowdowns.
Need to Monitor Your Connection Brokers? Want To Add Remote Desktop Canary Licensing?
If you need to increase your server license count to begin monitoring connection brokers, or if you’d like to add Remote Desktop Canary licenses (or convert to our Complete Monitoring and Management Bundle for RDS), please reach out to us via our sales form. We will contact you promptly to ascertain your needs and then present you with the most cost effective way to augment your licensing.
Our Own CEO Andy Milford Presented Two Sessions at Techmentor Redmond 2022
Techmentor 2022 was back live and in person at Microsoft’s Headquarters in Redmond, WA from August 8th-12th, 2022. Andy presented two different sessions there on topics that will be of interest to you:
- TH14 – Azure Virtual Desktop: Is It Worth the Hype and Cost (75 minutes)
- TF02 – Dont Get RDPwned: Everything Remote Desktop Security (Full Day Workshop)
The first session, which focused on all the hype around Azure Virtual Desktop, broke out in a brutally honest fashion whether or not AVD makes sense when compared to RDS for your organization. Be sure to check out RDPSoft’s AVD Resource Center for some related insights.
The second session was an eight hour deep dive on how to properly secure your RDS environment so you don’t get “RDPwned” and “ransomwared” by hackers. This full day session was anchored around the material in Andy’s previously published RDPwned book. Be sure to pick up your copy.
Remote Desktop Commander 6.0 Upgrade, Purchase, and Demo Links
If you are an existing Remote Desktop Commander SUITE subscription licensee and/or active maintenance agreement holder, click here to request upgrade instructions.
If you are an existing Remote Desktop Commander Lite or Premium Management Features customer, proceed to the Remote Desktop Commander Lite download page to download the client. Then install it over your previous version.
Or, learn more about:
- The Remote Desktop Commander Suite, including its feature set and how to start a subscription.
- Our Complete Monitoring and Management Bundle for RDS, including all the products included and how to start a subscription.
- Our Premium Management Features, including its feature set and how to start a subscription per named admin or technician per year.
Finally, you can also request a web demo with an RDPSoft solutions expert to see all our solutions’ features in depth.
Updated: January 2023.

[…] Remote Desktop Commander 6.0, we introduced a new Top Level Deployment Dashboard which displays the health of all of your Remote […]