
Version 5.0+ of the Remote Desktop Commander and Premium Management Features solutions offers something for everyone – whether you use our free Remote Desktop Commander Lite Client, or you have a license for our commercial products. For instance:
- The Remote Desktop Commander Suite now includes a brand new dashboard and report to track CPU usage by application, plus a new Agent Tuning Wizard and Agent Polling Diagnostics report.
- Our Premium Management Features overlay now offers the Client Side Connection Analyzer, which makes it very easy to troubleshoot RDP disconnects and other connection problems that your users experience on their Windows PCs.
- The Remote Desktop Commander Client now displays, sorts, and groups by user session connection time.
Now, let’s get into more detail. These helpful links will enable you to jump to your area of interest . . .
Track Terminal Server CPU Usage By Application
Tune Our Agent Service Using a New Agent Diagnostic Report and Polling Tuning Wizard
Troubleshoot RDP Disconnects With the Client Connection Analyzer
Session Connection Time Now Available in the Remote Desktop Commander Client
Windows Virtual Desktop – Separate Fact From Fiction, and Look Past the Hype
Next Steps: Upgrade, Purchase, and Demo Links
Quickly Find Out Which Applications Use the Most CPU on Your Terminal Servers

Existing customers expressed a need to quickly find out which programs are using the most memory on terminal servers – much like we already do with dashboards and application memory use.
Version 5.0+ now supports this feature. You can either use the CPU Use By Application Dashboard to review this, or you can run or schedule the CPU Use By Application Report.
For more information, including a full demonstration video, please see the recent blog article covering Terminal Server CPU usage and more.

Centrally Optimize Our Agent Service and Run Diagnostics With a Click of a Button
Many of our customers choose to deploy the Remote Desktop Reporter Agent Service on their session hosts to collect additional insights on terminal server performance, or to enhance user activity monitoring. Due to the fact that no RDS or WVD environment is alike, in terms of things like server load or disk space available for SQL Server, it is often necessary to tweak agent service parameters. Such parameters include the rate at which the agent service gathers data, the rate at which the master Remote Desktop Reporter service gathers the agent data, and the type of data collected by the agent.
Previously, this was done manually on individual session hosts by changing registry settings or redeploying the agent with different installer command line parameters.
In Remote Desktop Commander Version 5.0+, you can adjust agent polling rates and other agent related settings centrally. Simply make the desired changes in a wizard, then let Remote Desktop Commander contact each session host to adjust the polling parameters and restart the agent service for you.

Similarly, Version 5.0+ includes an Agent Diagnostics Report, which presents statistics about how agents are performing on your session hosts. For instance, you can view the average number of data points each agent transmits during each polling cycle, how quickly the agent service is gathering that data, and how quickly it is transferring that data to the primary Remote Desktop Reporter service across the network.
You can then use the results of this report to fine tune agent polling intervals within the Polling Tuning Wizard mentioned above.

Figure Out What’s Causing RDP Disconnects and Make Your Users Happy Again!
Ever had a user who just could not stay connected to your Remote Desktop Services deployment? They’ll promptly call up your IT department and offer vague complaints, telling you that their terminal server client (e.g. MSTSC.EXE) is trying to reconnect constantly, their session freezes and then they get kicked out, and on and on.
While previous versions of our Remote Desktop Commander Suite have been able to produce reporting on the latency and quality of the RDP collection for specific users, most of the valuable information regarding disconnects and other RDP connection failures exists on the client’s Windows computer, NOT the terminal servers themselves.
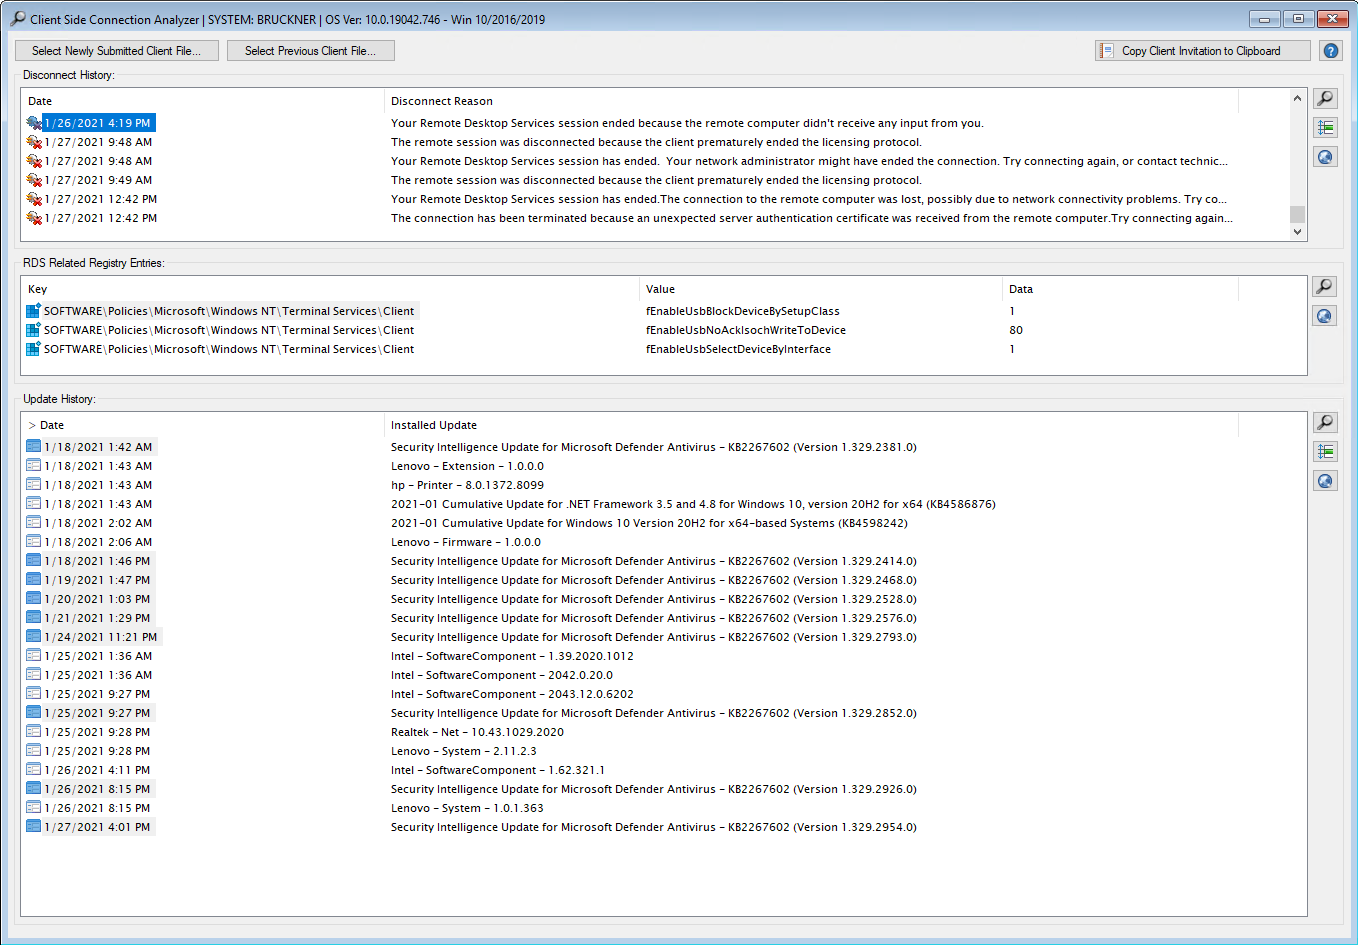
So, to make your life as an administrator or help desk tech easier, we created the Remote Desktop Connection Analyzer and built it into our Premium Management Features product. You can now send users having issues to our website, to download a lightweight applet which they run with no special user rights required, and no installation required. The applet will quickly gather up and translate all the RDP disconnection reasons, plus relevant registry keys that affect the Terminal Services Client and the Windows update history on their computer. It will then save all of this data to an encrypted file and prompt them to send that file back to you.
From there, you simply load that file into the Client Side Connection Analyzer, and voila! – you have the information you need at your fingertips. You can even do further research on the disconnect reasons via Google with a single click.
For more information on the Client Side Connection Analyzer, including a demonstration video, see this article on RDP disconnects.
Track and Sort By Session Connection Time in the Remote Desktop Session Navigator
Users of our Remote Desktop Commander Suite or our free Remote Desktop Commander Lite tool are very familiar with the Remote Desktop Session Navigator. This is the portion of the Remote Desktop Commander Client that allows you to manage active sessions and processes on RDS, WVD, and Citrix deployments.
When in Session View, you can sort and group sessions by things like Client Build, Username, Computer, Idle Time, etc. Many of our users have also requested that we include the Session Connection Time, so they can see when the user initially established their session on the server. Also, if you allow users to establish multiple sessions on terminal servers or on the farm in general, this feature comes in handy, as you can identify the oldest of a specific user’s sessions.
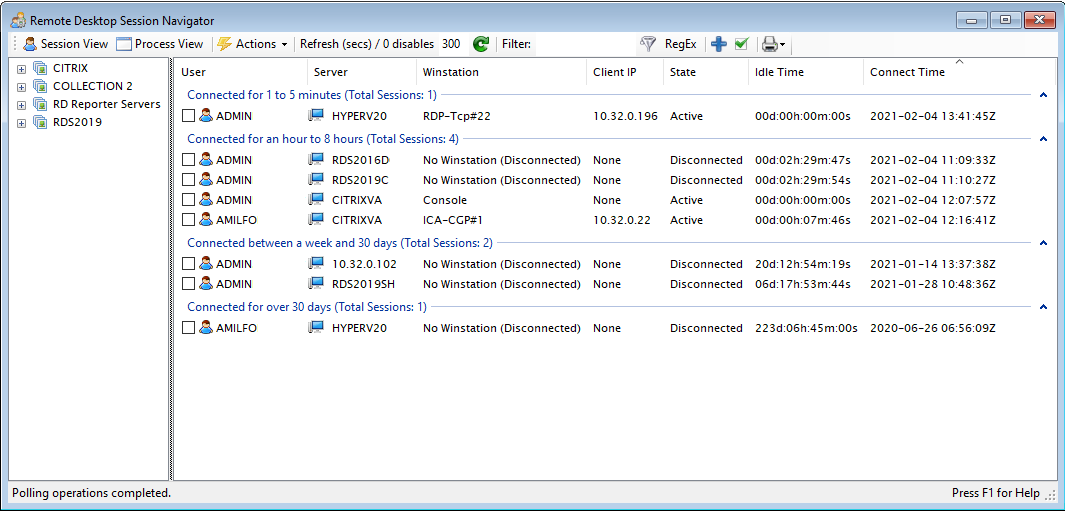
Note: If you upgrade your existing Remote Desktop Commander Suite or Remote Desktop Commander Lite programs (see below), you may need to make this new column visible first. Simply right mouse click on the column headers in the Remote Desktop Session Navigator, then place a check by the Connect Time column, and it will become visible.
Let’s Get Real About WVD
Yes, we’re an original Microsoft WVD partner, and yes, we anticipate that this technology will grow over time, but it’s very important that you have a true understanding about the pros and cons of WVD before you consider migrating away from Classic RDS.
In the first two articles of his new blog series, our CEO and Microsoft MVP Andy Milford challenges a ton of assumptions about WVD, and questions some of Microsoft’s motives around decisions like:
- refusing to make Windows 10 Multisession available outside of Azure,
- the inability to use WVD infrastructure components with session hosts located outside of Azure,
- the cost of WVD compute and Azure IaaS compute as compared to running RDS on-premises or in a private cloud,
- various WVD licensing pitfalls, especially for MSPs and ISVs.
Andy has written the first two blog posts in the series. See:
WVD – The Bloom Is Off The Rose – Part 1
WVD – The Bloom Is Off The Rose – Part 2
He is just getting started though, and there are many additional posts that will be added shortly to this blog series, so stay tuned!
Next Steps: Remote Desktop Commander Upgrade, Purchase, and Demo Links
If you are an existing Remote Desktop Commander Suite subscription licensee and/or active maintenance agreement holder, request upgrade instructions.
Learn more about the Remote Desktop Commander Suite, including its feature set and how to start a low cost subscription.
Learn more about Premium Management Features, including its feature set and how to start an affordable subscription.
Request a web demo with an RDPSoft solutions expert to see all our solutions’ features in depth.
Updated: October 2022.

Leave a Reply